Figures & data
Figure 1 The workflow of this study and scatter diagram of identified proteins. (A) Experimental workflow of proteomic profiling of lung tissues. (B) Abundance ratios of proteins are depicted for comparisons of patients with chronic obstructive pulmonary disease (COPD) and healthy donors. Proteins with an abundance ratio <0.667 or >1.50 were defined as significantly changed (SC) proteins. Downregulated proteins are represented as green dots, while upregulated proteins are depicted as red dots. Other proteins are defined as non-significantly changed (NC) proteins and are shown as gray dots.
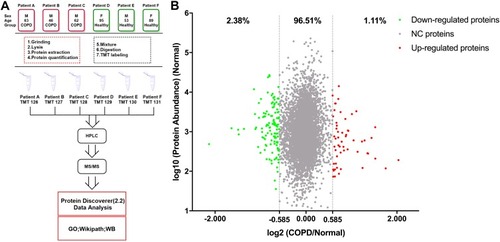
Figure 2 Gene ontology (GO) analysis demonstrating protein classification of significantly changed proteins using PANTHER (http://www.pantherdb.org/). (A) All significantly changed proteins are classified according to cellular component. (B) Upregulated and (C) downregulated proteins are classified based on biological process.
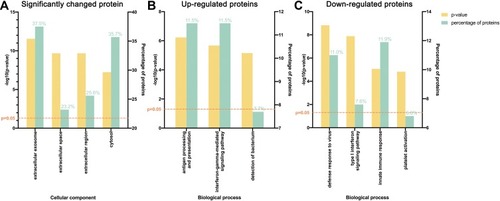
Figure 3 Protein–protein interaction networks. (A) The protein–protein interactions of all significantly changed proteins were analyzed with STRING (http://www.string-db.org). The MCODE plugin tool in Cytoscape was used for further analysis of densely connected regions. (B) Two highly connected clusters (Cluster 4 and Cluster 5) and proteins interacting with these clusters are shown. Cluster 4 is mainly related to the function of macrophages, and cluster 5 is closely related to platelet activation. The upregulated proteins are shown with a red background and the downregulated proteins are shown with a green background.
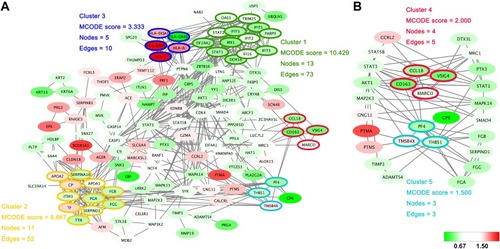
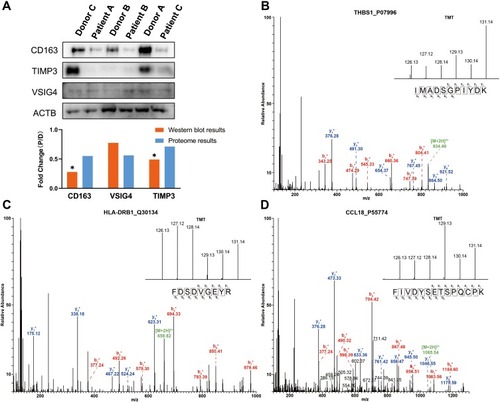
Figure 4 Western blot and MS/MS analyses indicating the changes in protein expression. (A) Western blot analyses of CD163, VSIG4 and TIMP3 expression in lung tissues of COPD patients and healthy donors. The results indicate the consistency with the mass spectrometry data. “D” represents healthy donors and “P” represents COPD patients. *P < 0.05 (two-tailed Student’s t-test). (B–D) The representative MS/MS spectrum data of THBS1, HLA-DRB1, and CCL18. The column height of the TMT diagram indicates the relative quantification of the peptide segment in Patients A, B, and C and Donors A, B, and C; 126.13 (TMT-126) for Patient A, 127.12 (TMT-127) for Patient B, 128.14 (TMT-128) for Patient C, 129.13 (TMT-129) for Donor A, 130.14 (TMT-130) for Donor B, and 131.14 (TMT-131) for Donor C.