
Figures & data
Table 1 Demographic Characteristics of the Patients
Figure 1 Study flow diagram.
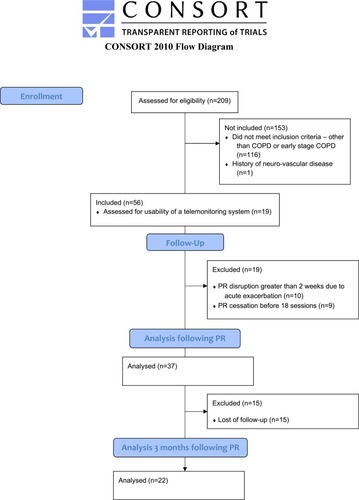
Figure 2 Evolution of the Montreal Cognitive Assessment tool total score (A) and sub-score (B). Data are shown as median (25th–75th percentile). Friedman test and Wilcoxon as a post hoc test for pairwise comparison for within-group comparison. Baseline: n=56; following PR: n=37, 3 months following PR: n=22. *p<0.01 **p=0.04.
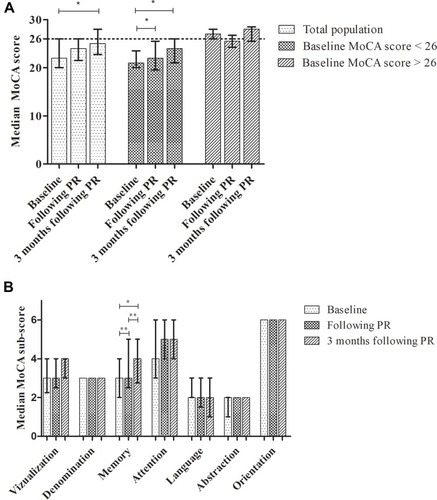
Table 2 Change in Secondary Outcomes Following and 3 Months After PR