Figures & data
Table 1 Basic Clinical Information of Participants
Table 2 Ten Most Up-Regulated and Down-Regulated Circular RNAs in COPD Patients Compared to Normal Controls
Table 3 Ten Most Up-Regulated and Down-Regulated mRNAs in COPD Patients Compared to Normal Controls
Figure 1 CircRNA and mRNA expression profile in COPD patients. Volcano plots were used to distinguish differentially expressed circRNAs (A) and mRNAs (B). Red and blue indicate up-regulation and down-regulation, respectively.
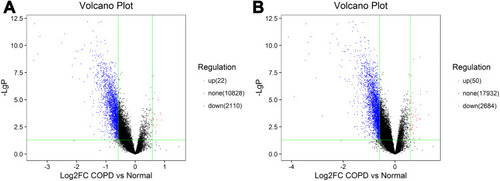
Figure 2 GO and KEGG pathway analysis. GO analysis of significantly up-regulated (A) and down-regulated (B) mRNAs clustered in the CC, MF, and BP. KEGG analysis of differentially up-regulated (C) and down-regulated mRNAs (D). The x‐axis shows ‐lgP, and the y-axis shows GO terms or KEGG pathways.
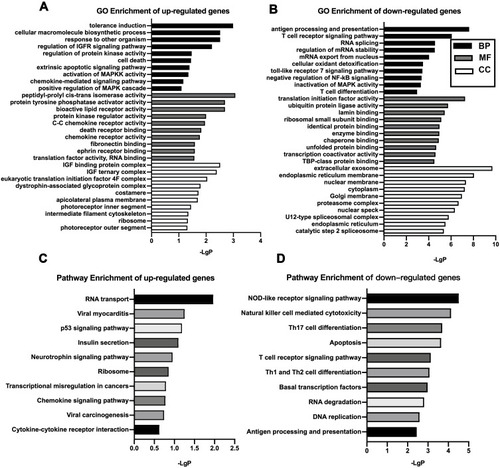
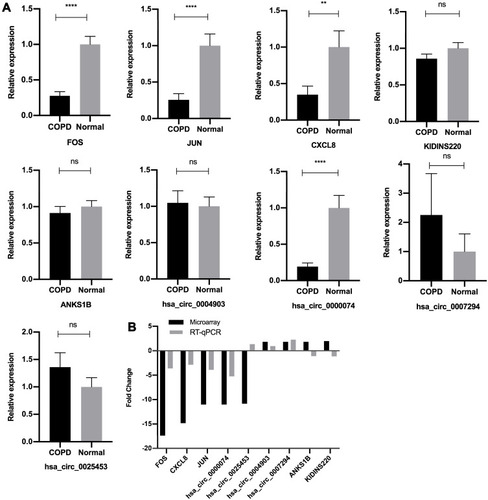
Figure 3 Validation of microarray data by RT‐qPCR. (A) Relative expression levels of the circRNAs and mRNAs between the COPD group and normal control group, assessed by RT-qPCR. The heights of the columns in the chart represent the relative expression (2−ΔΔCT). Data are mean ± SEM. All data were normalized to GAPDH gene expression. (B) Comparison of mean fold changes between microarray data and RT-qPCR results. SEM, standard error of the mean. ****P-value < 0.0001. **P-value < 0.001. ns, no significance.