Figures & data
Figure 1 Study flow chart.
Note: BreatheMate patient enrollment, treatment, and follow-up.
Abbreviations: BUD/FORM, budesonide/formoterol; CCQ, Clinical COPD Questionnaire; COPD, chronic obstructive pulmonary disease.
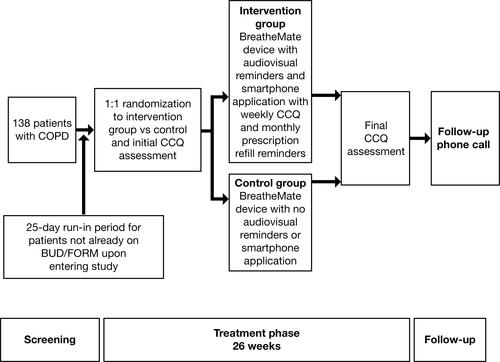
Figure 2 BreatheMate, smartphone application, and example patient data.
Notes: (A) Image of BreatheMate device attached to pMDI and screenshot of the smartphone application. (B) Data recorded via the BreatheMate device show representative results for a patient in the control group (note that the dotted line represents the prescribed number of puffs/day prescribed for appropriate use). (C) Data recorded via the BreatheMate device show representative results for a patient in the intervention group, who received daily reminders to take their medication (note that the dotted line represents the prescribed number of puffs/day prescribed for appropriate use).
Abbreviation: pMDI, pressurized metered-dose inhaler.
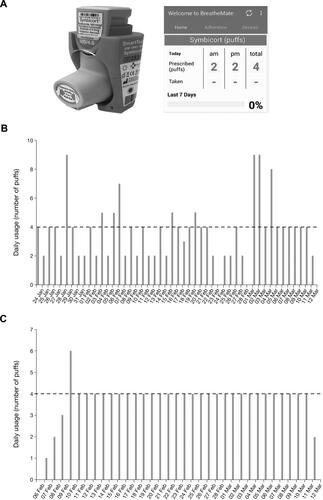
Table 1 Patient Demographics
Figure 3 CONSORT flow diagram.
Note: aThe n = 100 patients who completed the study also comprised the per-protocol analysis set, which consisted of all patients who met all eligibility criteria and were screened, randomized, and took ≥1 inhalation of study budesonide/formoterol, with ≥60 days of device time on study and without any major protocol deviations.
Abbreviation: CONSORT, Consolidated Standards of Reporting Trials.
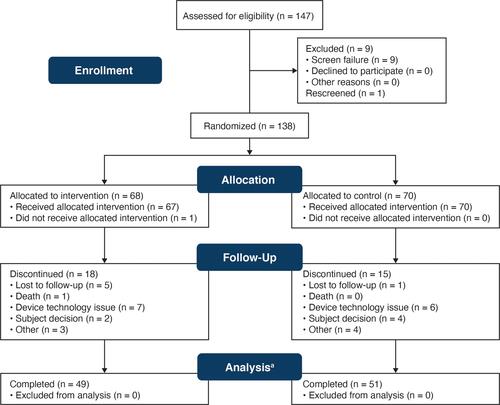
Figure 4 Mean adherence to budesonide/formoterol during the study: FAS.
Notes: Budesonide/formoterol adherence among control and intervention group patients during the study, quantified as (A) the number of adherent daysa for device time on study, (B) the number of adherent setsb of puffs per day for device time on study, and (C) patients with ≥80% adherence for device time on study. aAn adherent day was defined as 2 puffs taken within 60 minutes of each other, occurring twice in a single calendar day. bAn adherent set of puffs was defined as 2 puffs taken within 60 minutes of each other. cIndicates the Satterthwaite t-statistic is reported.
Abbreviations: FAS, full analysis set; SD, standard deviation.
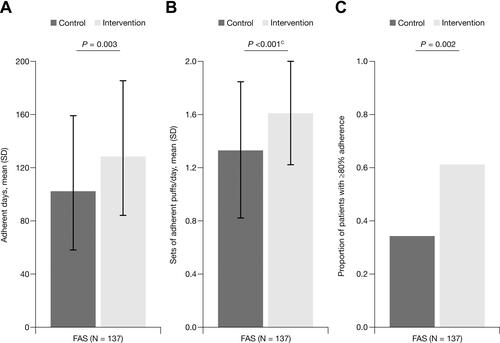
Figure 5 Mean sets of adherent budesonide/formoterol puffs/day during each 60-day study interval: FAS.
Note: Budesonide/formoterol adherence among control and intervention group patients across three different 60-day study intervals.
Abbreviations: FAS, full analysis set; SD, standard deviation.
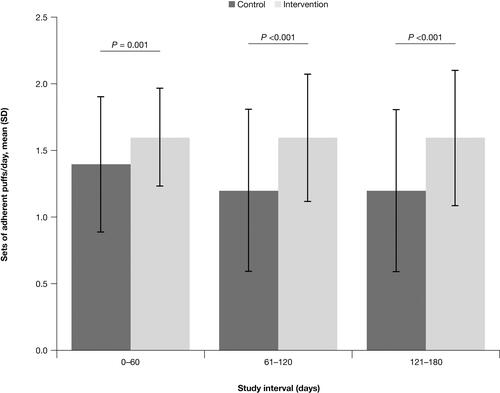
Figure 6 Number of adherent,a underuse,b overuse,c and no used days: FAS.
Notes: Classification of budesonide/formoterol use by patients in the control and intervention groups over the course of the study. aAdherent days are the number of study days a patient was adherent (exactly two sets of 2 puffs [4 puffs total], with both puffs of a set taken within 60 minutes of each other) with their budesonide/formoterol medication. bUnderuse days are the number of study days a patient took between 1 and 3 inhalations of their budesonide/formoterol medication on a given day. cOveruse days are the number of study days a patient took ≥5 inhalations of their budesonide/formoterol medication. dNo use days are the number of days a patient did not take their budesonide/formoterol medication.
Abbreviation: FAS, full analysis set.
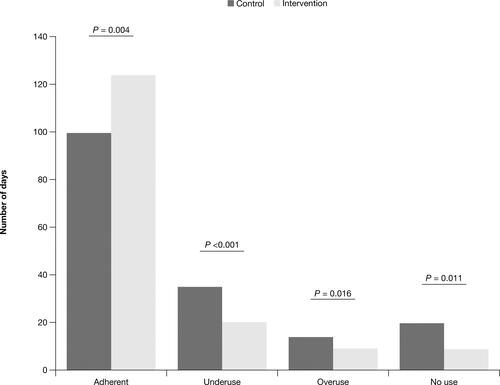
Figure 7 Odds of ≥80% adherence by subgroup: FAS (95% CI).a
Notes: Odds of adhering to budesonide/formoterol treatment across patient demographic subgroups. aLogistic regression model. The odds ratio for the reference group in each category is set to 1. bP <0.05.
Abbreviations: CI, confidence interval; FAS, full analysis set.
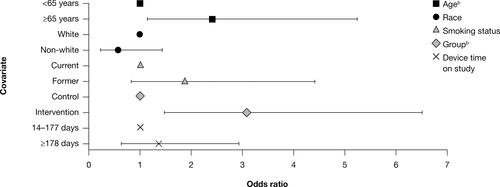
Figure 8 Mean CCQ scores at baselinea and EOTb: FAS.
Notes: CCQ scores range from 0 to 6, with higher values indicative of poorer health status. aBaseline is the date of randomization. bEOT is the latest date among assessments completed around the date the final phone/device was returned.
Abbreviations: CCQ, Clinical COPD Questionnaire; COPD, chronic obstructive pulmonary disease; FAS, full analysis set; EOT, end-of-treatment visit.
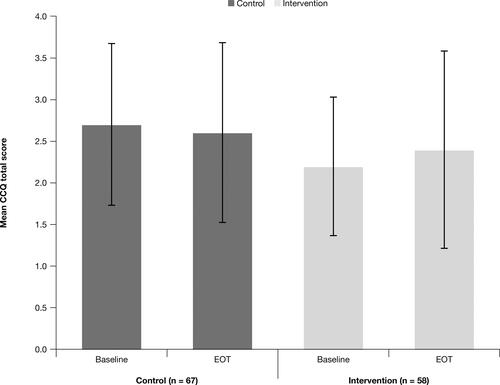
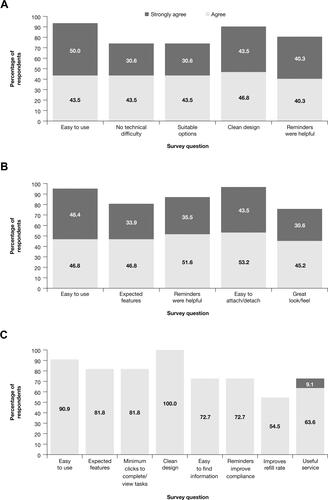
Figure 9 Patient and provider satisfaction reports.
Notes: Patient satisfaction with (A) the smartphone application and (B) the BreatheMate device, as well as (C) study investigator/coordinator satisfaction with the BreatheMate web portal,a respectively. aSome physicians (n = 5) did not use the web portal. All eight study coordinators did use the web portal.