
Figures & data
Table 1 Characteristics of the Study Population (n = 137), Grouped by GOLD 2011 Stage at Baseline*
Figure 1 One-year probabilities of transition between different GOLD 2011 (A) and GOLD 2017 (B) stages during a 2-year follow-up. Circles represent a single state for the beginning of each 1-year period. Straight arrows represent the probability of changing to another stage; curved arrows represent continuing in the same stage for another 1-year period.
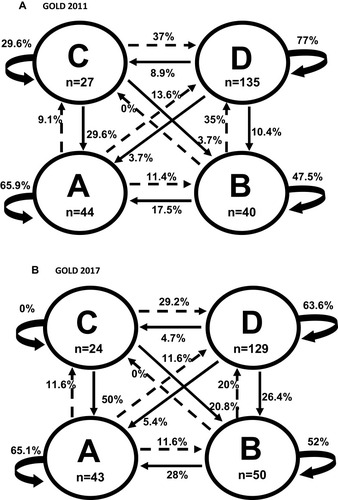
Figure 2 Percentages of non-transitions, improving transitions, and worsening transitions from each GOLD stage for each classification (GOLD 2011 and 2017).
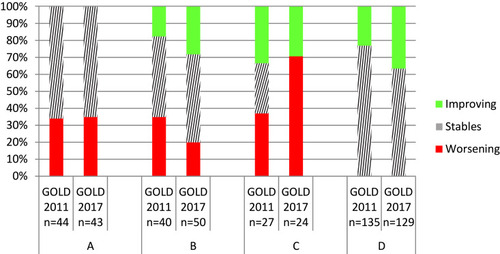
Figure 3 Frequency of GOLD 2011 stages after two years according to baseline stages.
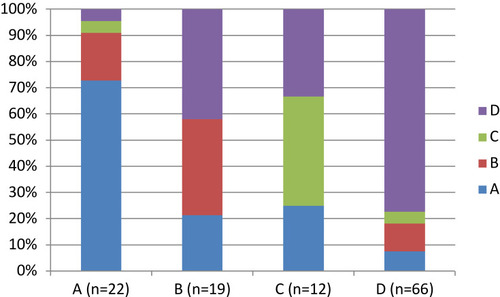
Table 2 Multivariate Regression Models Show the Predictive Strengths of Clinical and Pulmonary Factors for Worsening Transitions vs Improving Transitions and Non-Transitions in GOLD 2011 (N = 39, 1-Year Transitions)
Table 3 Multivariate Regression Models Show the Predictive Strengths of Each One of Non-Pulmonary Factors with Worsening Transitions vs Improving Transitions and Non-Transitions in GOLD 2011 (N = 39 1-Year Transitions)