Figures & data
Table 1 Baseline Characteristics of the SUMMIT Derivation Population and the Four Risk Score Validation Populations
Table 2 The Association of Quartiles of the Summit Risk Score with All-Cause Mortality in the Internal SUMMIT Validation Population Subset and in the Intermountain Outpatients with COPD and Cardiovascular Risks. As per , Length of Follow-Up for Mortality Differed Between Populations
Figure 1 Kaplan–Meier survival curves displaying the association of the Summit Risk Score with all-cause mortality among: (A) the validation half of the SUMMIT trial population, N=8304 (for quartiles 4, 3, and 2 compared with quartile 1: Log rank p<0.001, p<0.001, and p=0.002, respectively; c-statistic: c=0.662), (B) an Intermountain Healthcare validation population of outpatients with COPD and cardiovascular risks, N=9251 (for quartiles 4, 3, and 2 compared with quartile 1: Log rank p<0.001, p<0.001, and p<0.001, respectively; c-statistic: c=0.736). Time intervals on the x-axes were designated in 365-day intervals for SUMMIT populations and years for Intermountain populations.
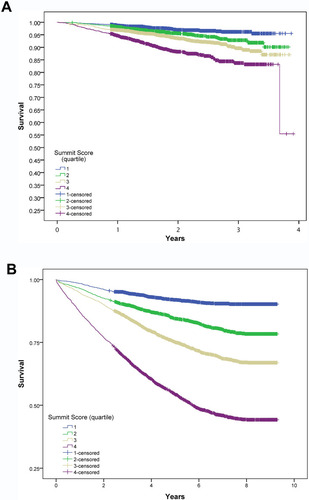
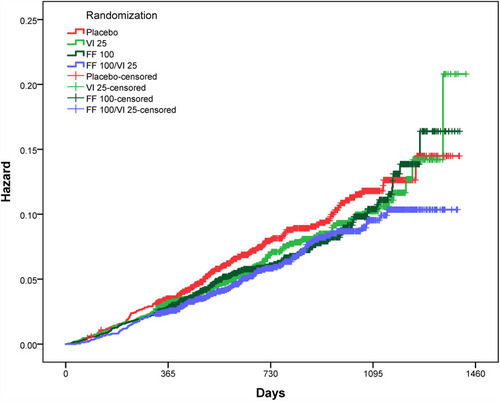
Figure 2 Hazard curves for the effects of the four SUMMIT trial randomized treatments on all-cause mortality among all SUMMIT trial subjects (ie, both the Summit Score derivation and validation groups). Trial randomizations included: once daily inhaled placebo, vilanterol (VI) 25 μg, fluticasone furoate (FF) 100 μg, or the combination of FF 100 μg and VI 25 μg. Here the combination of FF 100 μg/VI 25 μg (n=2347) had a statistically significantly lower mortality compared with placebo (n=2305) (p=0.0158, HR= 0.76, CI=0.61, 0.95) among subjects with a Summit Score ≥14 and ≤19 (n=9243, which is 56.1% of the SUMMIT trial subjects). The hazard curves for subject with Summit Score ≤13 and ≥20 are provided in Supplemental Figures S2B and S2C.