Figures & data
Table 1 Details for GEO COPD Data
Figure 1 Flow chart of constructing the miRNA–mRNA regulatory network in COPD plasma.
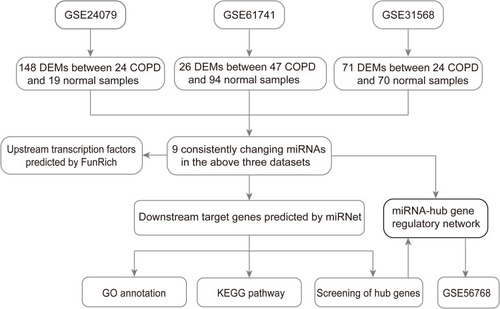
Figure 2 Identification of the candidate DEMs.
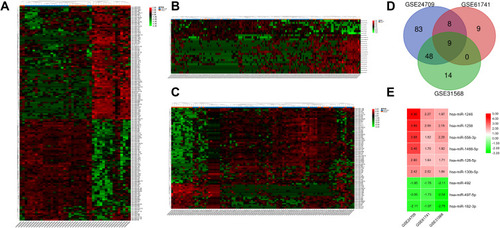
Figure 3 Potential transcription factors of DEMs predicted by FunRich.
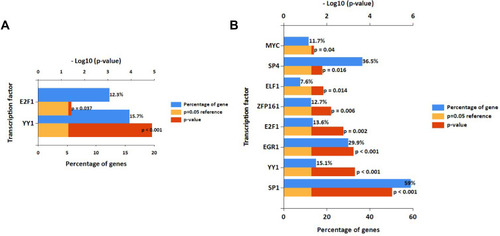
Table 2 Potential Target Genes of the Significantly Upregulated and Downregulated DEMs
Figure 4 Potential target genes of DEMs predicted by miRNet.
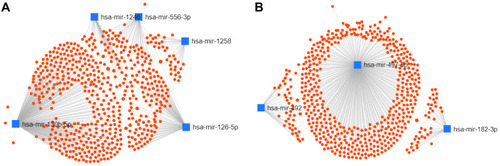
Figure 5 GO annotation analysis for the target genes of DEMs in the biological process, cellular component, and molecular function.
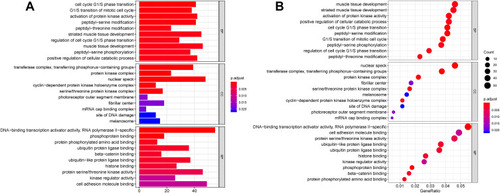
Figure 6 KEGG pathway analysis for the target genes of DEMs.
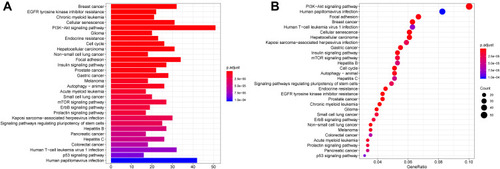
Table 3 Top 10 Hub Genes of the Significantly Upregulated and Downregulated DEMs in the PPI Network Ranked by MCC
Figure 7 Identification of the hub genes for DEMs in the PPI network.
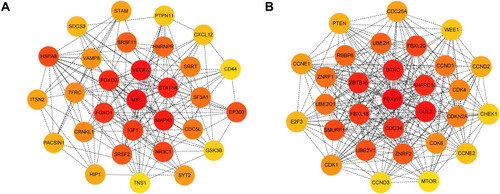
Figure 8 The miRNA-hub gene regulatory network.
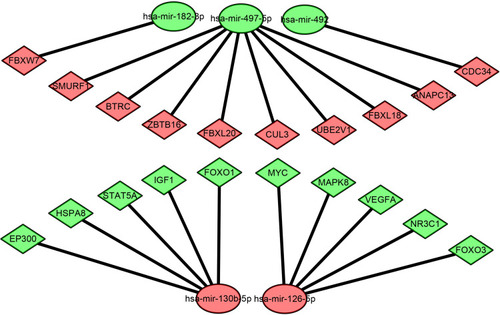
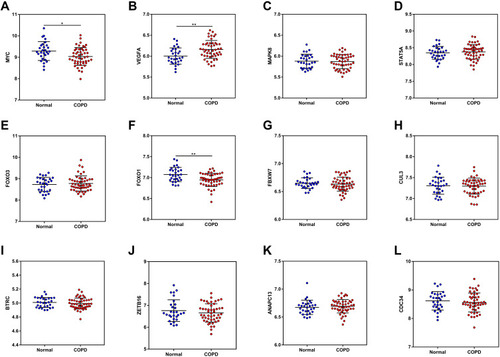
Figure 9 The mRNA expression of the top 12 hub genes was determined from the GSE56768 dataset.