Figures & data
Figure 1 The expression level of LINC00612 in lung tissues and HPMECs exposed to CSE. (A) RT-qPCR assay was applied to measure the expression level of LINC00612 in lung tissues (NS: non-smokers, n=10, SM: smokers, n=10, and smokers with COPD, n=22). (B, C) The expression level of LINC00612 was assessed by RT-qPCR assay in HPMECs exposed to 2.5% CSE for indicated times or treated with CSE at different concentrations for 24 h. Data shown are mean±SD and from three independent experiments. *P<0.05.
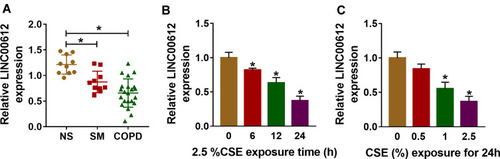
Figure 2 LINC00612 regulated apoptosis, inflammation, and oxidative stress in HPMECs treated with CSE. (A) The expression level of LINC00612 was quantified by RT-qPCR in HPMECs transfected with LINC00612 or vector. (B–I) HPMECs were divided into three groups: vector, 2.5% CSE+vector, and 2.5% CSE+LINC00612. (B) The percentage of apoptotic cells was shown by flow cytometry assay in HPMECs. (C) The caspase-3 assay kit was used to examine the caspase-3 activity in HPMECs. (D–E) The expression levels of IL-6 and TNF-α were assessed by ELISA kits in supernatant. (F–I) The oxidative stress was analyzed in HPMECs by measuring ROS production, MDA level, SOD activity, and GSH/GSSG ratio with colorimetric assay kits. Data shown are mean±SD and from three independent experiments. *P<0.05.
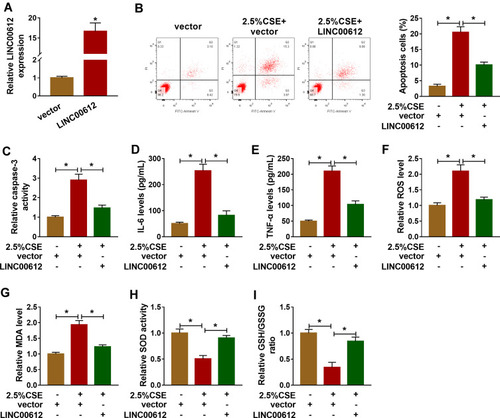
Figure 3 miR-31-5p was upregulated in COPD tissues and was a target of LINC00612. (A) LINC00612 had the complementary sequence in miR-31-5p by bioinformatics analysis. (B) Transfection efficiency of miR-31-5p was assessed by RT-qPCR assay in HPMECs, with miR-NC as control. (C) The relative luciferase activity was analyzed by dual-luciferase reporter assay in HPMECs co-transfected with miR-31-5p mimic or miR-NC and indicated luciferase reporter vectors. (D) The enrichments of LINC00612 and miR-31-5p were detected by RT-qPCR assay after RIP assay. (E) The biotinylated bio-miR-31-5p-wt or bio-miR-31-5p-mut was transfected into HPMECs for RNA pull-down assay, with bio-miR-NC as control. (F, G) RT-qPCR assay was used to quantify the expression levels of LINC00612 and miR-31-5p in HPMECs transfected with si-NC, si-LINC00612, vector, or LINC00612. (H, I) The expression level of miR-31-5p was estimated by RT-qPCR assay in lung tissues (NS: non-smokers, n=10, SM: smokers, n=10, and smokers with COPD, n=22) and HPMECs exposed to 2.5% CSE for 24 h. (J) The relationship between LINC00612 and miR-31-5p was analyzed by Pearson’s correlation analysis in COPD tissues. Data shown are mean±SD and from three independent experiments. *P<0.05.
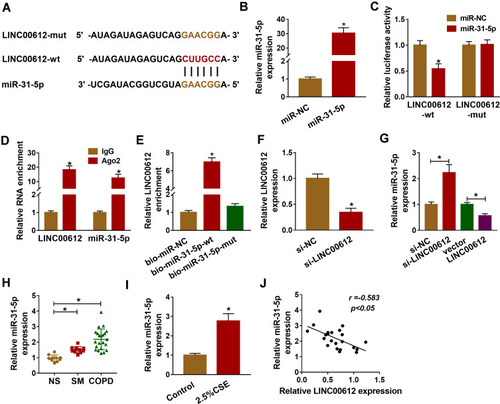
Figure 4 Overexpression of LINC00612 abolished CSE-induced effects on apoptosis, inflammation, and oxidative stress in HPMECs by regulation miR-31-5p. (A–H) HPMECs were treated with vector+miR-NC, 2.5% CSE+vector+miR-NC, 2.5% CSE+LINC00612+miR-NC, or 2.5% CSE+LINC00612+miR-31-5p. (A) The flow cytometry assay was performed to monitor cell apoptosis in HPMECs. (B) The caspase-3 activity in HPMECs was assessed by colorimetric assay kit. (C, D) ELISA kits were applied to assess the expression levels of IL-6 and TNF-α in supernatant. (E–H) ROS production, MDA level, SOD activity, and GSH/GSSG ratio were evaluated with assay kits. Data shown are mean±SD and from three independent experiments. *P<0.05.
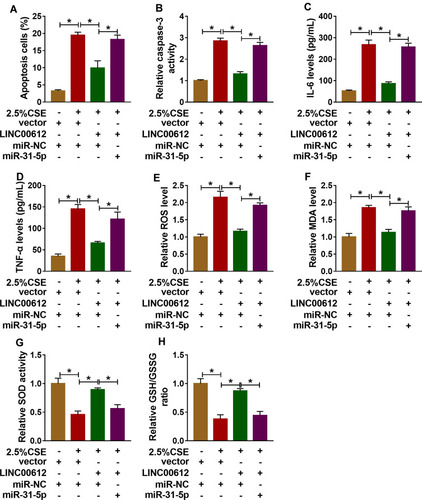
Figure 5 Notch1 was a target of miR-31-5p in HPMECs. (A) Binding region between miR-31-5p and 3ʹUTR of Notch1, as well as mutated nucleotides of Notch1 3ʹUTR are shown. (B) Dual-luciferase reporter assay was carried out to examine the luciferase activity in HPMECs. (C) RT-qPCR assay was used to show the expression level of miR-31-5p in HPMECs transfected with anti-miR-31-5p or anti-NC. (D) The protein expression level of Notch1 was measured by western blot assay in HPMECs transfected with anti-miR-31-5p, anti-NC, miR-NC, or miR-31-5p. (E, F) RT-qPCR and western blot assays were conducted to assess Notch1 levels in tissues (NS: non-smokers, n=10, SM: smokers, n=10, and smokers with COPD, n=22) and HPMECs exposed to 2.5% CSE. (G) The relationship between miR-31-5p and Notch1 was analyzed by Pearson’s correlation analysis in COPD tissues. Data shown are mean±SD and from three independent experiments. *P<0.05.
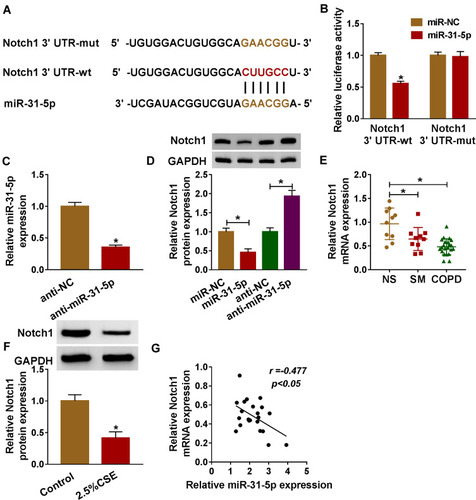
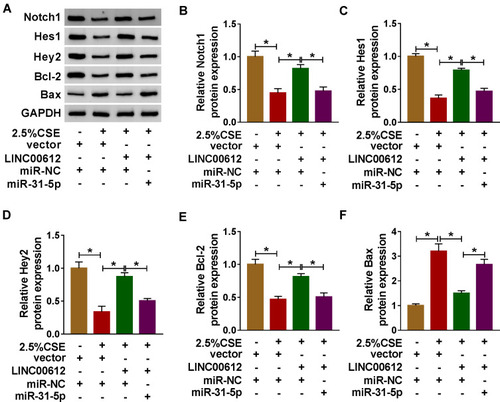
Figure 6 The expression levels of Notch signaling pathway-related proteins in CSE-induced HPMECs. (A–F) HPMECs were treated with vector+miR-NC, 2.5% CSE+vector+miR-NC, 2.5% CSE+LINC00612+miR-NC, or 2.5% CSE+LINC00612+miR-31-5p. (A) The representative pictures of western blot assay are presented. (B–F) The protein expression levels of Notch1, Hes1, Hey2, Bcl-2, and Bax were quantified by western blot assay in CSE-induced HPMECs. Data shown are mean±SD and from three independent experiments. *P<0.05.