Figures & data
Figure 1 Study design. *Primary efficacy assessments on Day 29–12 hours after the last dose of icenticaftor. **A total of 92 patients were randomized. The first 4 patients in the study received icenticaftor 450 mg b.i.d. or placebo, prior to the protocol amendments reducing the dose to icenticaftor 300 mg b.i.d. #Patients continued on background COPD therapy throughout the study. During the entire study duration, subjects were maintained on stable baseline COPD therapy.
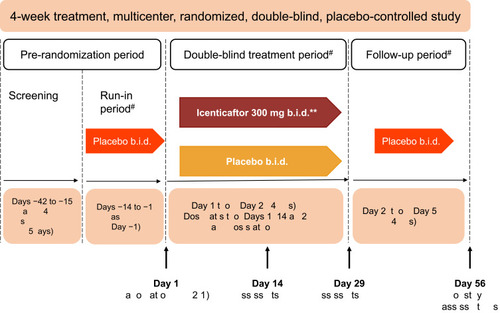
Figure 2 Patient disposition.
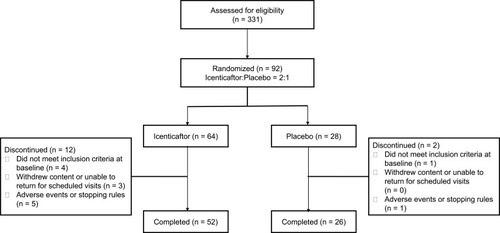
Table 1 Patient Demographics and Clinical Characteristics at Baseline (Safety Set)
Table 2 Modeled Data on Change from Baseline of LCI and FEV1 Pre- and Post-Bronchodilator (Efficacy Set)
Figure 3 Raw mean change from baseline per treatment arm over time for pre-bronchodilator FEV1, post-bronchodilator FEV1, and lung clearance index (LCI). Numbers at each data point represent number of patients; error bars are indicative of standard error.
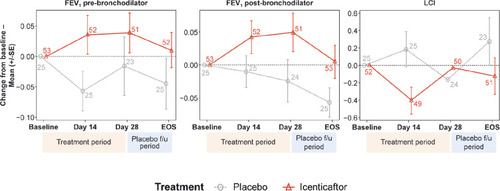
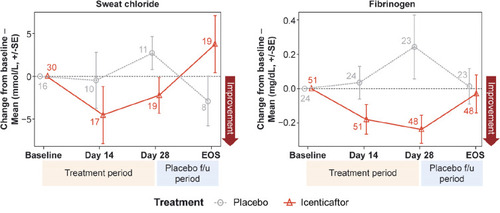
Figure 4 Mean change from baseline for sweat chloride (A) and fibrinogen (B) over time. Numbers at each data point represent number of patients; error bars are indicative of standard error.