Figures & data
Figure 1 The swallowing monitor. The figure shows a non-invasive swallowing monitoring system using a film-type piezoelectric sensor taped to the front neck to detect swallowing sound and laryngeal movement, while a nasal canula-type flow sensor detects the respiratory flow.
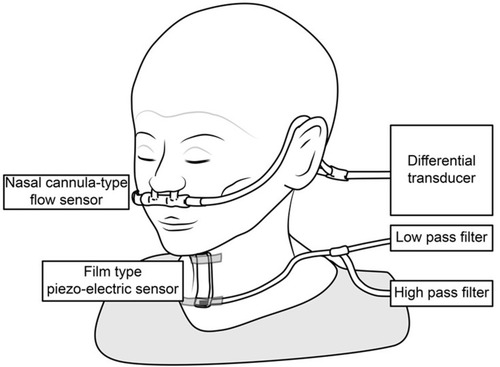
Table 1 Patient Characteristics
Figure 2 Tongue pressure measurements in the exacerbation group and the non-exacerbation group. There was no significant difference in the average of the three tongue pressure measurements between the two groups (29.5 ± 11.1 kPa vs 29.9 ± 9.4 kPa, respectively, p = 0.49).
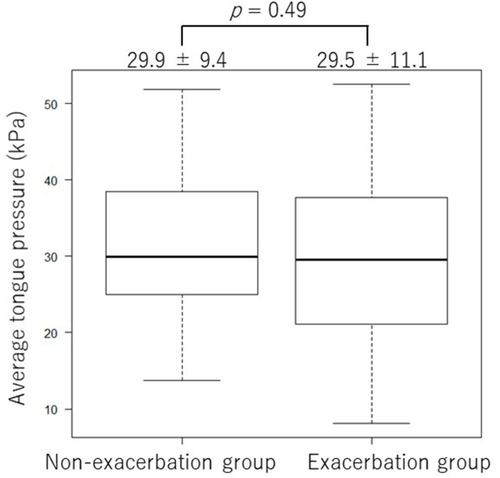
Figure 3 Skeletal muscle mass index and COPD exacerbation. (A) Skeletal muscle mass index in the Exacerbation group and the non-exacerbation group. The skeletal muscle mass index was significantly lower in the Exacerbation group than in the Non-exacerbation group (6.8 ± 1.0 kg/㎡ and 6.1 ± 0.9 kg/㎡, respectively, p = 0.02). (B) Results of the ROC curve analysis using the skeletal muscle mass index. When the cut-off value was set at 6.5 kg/㎡, the sensitivity and specificity were 75.0% and 57.1%, respectively, and the area under the ROC curve was 0.67 (95% confidence interval [CI], 0.536–0.796). (C) Kaplan–Meier curves of the time to first exacerbation (any severity) stratified by the skeletal muscle mass index cut-off value of 6.5. The time to first exacerbation was significantly longer in patients with an SMI higher than 6.5 kg/㎡ than in patients with an SMI 6.5 kg/㎡ or lower (p= 0.0145).
![Figure 3 Skeletal muscle mass index and COPD exacerbation. (A) Skeletal muscle mass index in the Exacerbation group and the non-exacerbation group. The skeletal muscle mass index was significantly lower in the Exacerbation group than in the Non-exacerbation group (6.8 ± 1.0 kg/㎡ and 6.1 ± 0.9 kg/㎡, respectively, p = 0.02). (B) Results of the ROC curve analysis using the skeletal muscle mass index. When the cut-off value was set at 6.5 kg/㎡, the sensitivity and specificity were 75.0% and 57.1%, respectively, and the area under the ROC curve was 0.67 (95% confidence interval [CI], 0.536–0.796). (C) Kaplan–Meier curves of the time to first exacerbation (any severity) stratified by the skeletal muscle mass index cut-off value of 6.5. The time to first exacerbation was significantly longer in patients with an SMI higher than 6.5 kg/㎡ than in patients with an SMI 6.5 kg/㎡ or lower (p= 0.0145).](/cms/asset/23b3c308-1a50-4bef-9a17-014085dc3f53/dcop_a_12198262_f0003_b.jpg)
Figure 4 I-SW in 3 mL swallows and COPD exacerbation. (A) The incidence of I-SW in 3 mL swallows. The 3 mL I-SW% (the percentage of swallows in which inspiration preceded the swallow, out of the ten 3 mL swallows) was significantly lower in the E group than in the non-E group (7.2 ± 10.2 vs 17.4 ± 17.6 times, p =0.007). (B) Results of the ROC curve analysis using the frequency of I-SW (%) of all the 3 mL swallows. When the cut-off value was set at 0, the sensitivity and specificity were 60.7% and 71.4%, respectively, and the area under the ROC curve was 0.68 (95% confidence interval [CI], 0.562–0.802). (C) Kaplan–Meier curves of the time to first exacerbation (any severity) stratified by the presence of one or more I-SW. The time to first exacerbation was significantly longer in patients with one or more I-SW than those with no I-SW (median, not available vs 262 days, p = 0.002).
![Figure 4 I-SW in 3 mL swallows and COPD exacerbation. (A) The incidence of I-SW in 3 mL swallows. The 3 mL I-SW% (the percentage of swallows in which inspiration preceded the swallow, out of the ten 3 mL swallows) was significantly lower in the E group than in the non-E group (7.2 ± 10.2 vs 17.4 ± 17.6 times, p =0.007). (B) Results of the ROC curve analysis using the frequency of I-SW (%) of all the 3 mL swallows. When the cut-off value was set at 0, the sensitivity and specificity were 60.7% and 71.4%, respectively, and the area under the ROC curve was 0.68 (95% confidence interval [CI], 0.562–0.802). (C) Kaplan–Meier curves of the time to first exacerbation (any severity) stratified by the presence of one or more I-SW. The time to first exacerbation was significantly longer in patients with one or more I-SW than those with no I-SW (median, not available vs 262 days, p = 0.002).](/cms/asset/baac66b3-8a09-4bc0-ab13-c251ec701ac2/dcop_a_12198262_f0004_b.jpg)
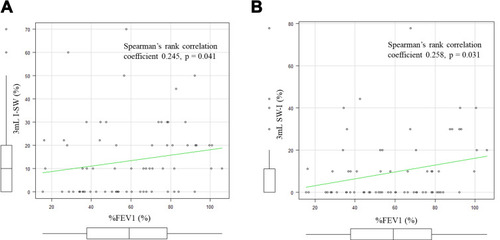
Figure 5 I-SW%, SW-I% and %FEV1. (A) The correlation between the I-SW% in 3mL water and %FEV1. The I-SW% and %FEV1 showed a positive correlation (Spearman’s rank correlation coefficient 0.245, p = 0.041). (B) The correlation between the SW-I% in 3mL water and %FEV1. The SW-I% and %FEV1 also showed a positive correlation (Spearman’s rank correlation coefficient 0.258, p = 0.031).