Figures & data
Table 1 Clinical Characteristics of the Subjects Recruited for the Microarray
Figure 1 The differential expression of lncRNAs and mRNA in COPD and non-COPD lung tissues. (A) The volcano plot of differential expressed lncRNAs in COPD compared to non-COPD lung tissues. The expressions of lncRNAs were presented in red (≥2-fold change and P<0.05), green (≥2-fold change but P≥0.05), blue (≤2-fold change and P<0.05), and gray (NS). (B) Hierarchical clustering showed the top differential expression of lncRNAs in COPD (red bar) and non-COPD (blue bar) lung tissues. The expression was displayed on a scale from light (low) to deep (high). (C) The volcano plot of differentially expressed mRNAs in COPD compared to non-COPD lung tissues. The expression of upregulated mRNAs was presented in red (≥2-fold change and P<0.05), downregulated in green (≥2-fold change and P<0.05) and gray (NS). (D) The hierarchical clustering of all differential expressed mRNAs in COPD (red bar) compared to non-COPD (blue bar) lung tissues. The expression was displayed on a scale from green (low) to red (high).
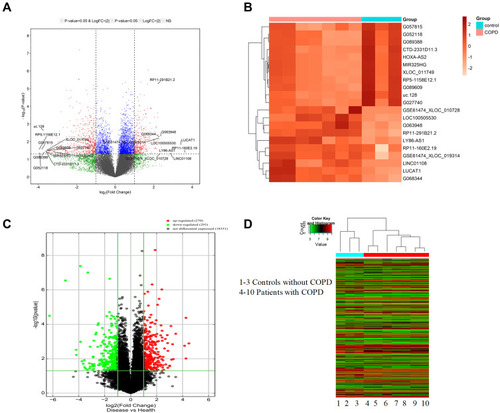
Table 2 The Verification of Microarray Analysis Selected from Different Expressed Long Non-Coding RNAs in the List
Figure 2 KEGG pathway analysis and GO enrichment analysis of differentially expressed mRNAs. (A and B) The significantly upregulated (A) and downregulated (B) pathways in COPD vs non-COPD patients. The P-value (EASE-score, Fisher’s P-value, or hypergeometric P-value) denotes the significance of the pathway correlated to the conditions. The lower the P-value, more significant is the pathway (the recommended P-value cutoff is 0.05). (C and D) GO analysis about the top ten counts of enrichment score in the biological process. Up-regulated (C) and down-regulated (D) in the biological process. (E and F) GO analysis of the top ten counts of enrichment score in the biological process. Up-regulated (E) and down-regulated (F) gene molecular function. (G and H) GO analysis of the top ten counts of enrichment score of up-regulated (G) and down-regulated (H) cellular component.
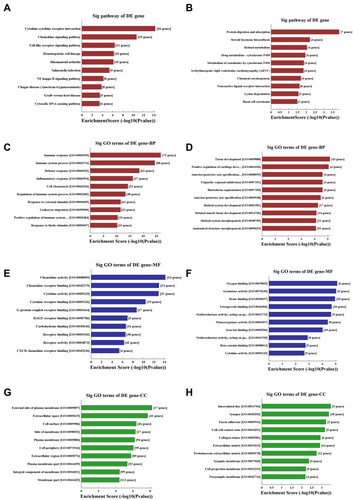
Figure 3 CSE treatment inhibited the proliferation of HPMECs and reduced HOXA-AS2 expression. (A) HPMECs were treated with different concentrations of CSE, including 0, 0.5%, 1.0%, 2.5%, and 5.0% for 24 h, and the proliferation of HPMECs was measured by CCK-8 assay. (B) HPMECs was exposed to CSE of different concentrations (0, 0.5%, 1.0%, 2.5%, and 5.0%) for 24 h, and the relative expression levels of HOXA-AS2 was measured by real-time-PCR. At the concentrations of 2.5% and 5% CSE, the cell viability decreased significantly. (C) HPMECs were treated with 2.5% CSE for different amounts of time, and the relative expression levels of HOXA-AS2 were measured by real-time PCR. The expression of HOXA-AS2 decreased significantly as the treatment time extended. Data are presented as mean ± SEM. *P < 0.05. We used GAPDH as the internal loading control and calculated the relative expression of lncRNA by 2−∆∆CT method. All experiments were performed independently at least 3 times.
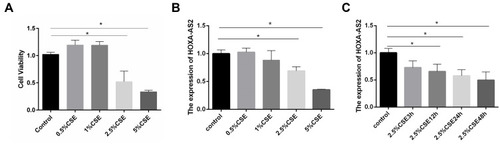
Figure 4 HOXA-AS2 promoted the proliferation of HPMECs. (A) Three kinds of siRNAs were transfected into HPMECs, and the relative expression levels of HOXA-AS2 were measured by real-time PCR. All the siRNAs could cause significant decrease in HOXA-AS2 expression. (B) HPMECs were transfected with negative control (NC) and HOXA-AS2 siRNA for 24 h, and cell viability was measured by CCK-8 assay. This showed that the silence of HOXA-AS2 decreased the proliferation of HPMECs. (C) After transfection with HOXA-AS2 overexpression lentiviral vectors and empty lentiviral vectors, HPMECs were incubated with 2.5% CSE for 24 h. Then, the cell viability was measured by CCK-8 assay. The results suggested that HOXA-AS2 promoted the viability of HPMECs and partly rescued the damage of cell proliferation induced by CSE. All data are presented as mean ± SEM. *P < 0.05. We used GAPDH as the internal loading control and calculated the relative expression of lncRNA by 2−∆∆CT method. All experiments were performed independently at least 3 times.
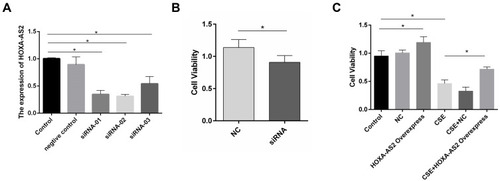
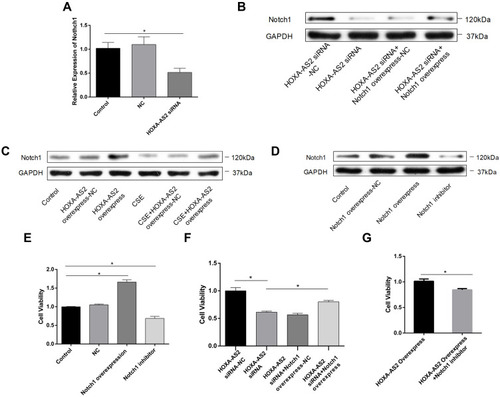
Figure 5 HOXA-AS2 promote HPMECs proliferation through regulating Notch1. (A) HOXA-AS2 siRNAs were transfected into HPMECs for 24 h, and the relative expression levels of Notch1 were measured by real-time PCR. Notch1 mRNA decreased in HOXA-AS2 knocking down HPMECs. (B–D) Western blot was used to analyze the expression of Notch1 protein after transfection with HOXA-AS2 siRNA, overexpressing HOXA-AS2 lentivirus, Notch1 overexpression plasmid or Notch1 inhibitor gamma-Secretase Inhibitor IX (GSI-IX, DAPT 10 mM for 24 h) in HPMECs. (E–G) Cell Counting Kit-8 (CCK-8) assay was used to measure HPMECs viability after treatment. All data are presented as mean ± SEM. *P < 0.05. All experiments were performed independently at least 3 times.