Figures & data
Table 1 Subjects’ Baseline Characteristics (n=55)
Table 2 Results of Baseline Respiratory Impedance at Rest (n=55)
Table 3 Results of Baseline Respiratory Impedance at Rest in the Various GOLD Stages (Stages I–IV) (n=55)
Figure 1 Inspiratory impedance at rest in the various GOLD stages (stages I–IV) (n=55). (A) Respiratory resistance and GOLD stages at baseline. (B) Respiratory reactance and GOLD stages at baseline. Sixteen subjects were GOLD stage I or II and 39 subjects were GOLD stage III or IV. **p<0.01 by the Mann–Whitney U-test.
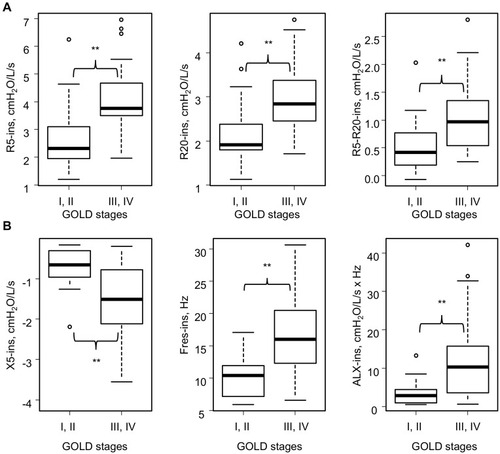
Table 4 Results of Cardiopulmonary Exercise Testing at Peak Exercise and at Rest (n=55)
Table 5 Results of Cardiopulmonary Exercise Testing (CPET) at Rest and at Peak Exercise in Various GOLD Stages (Stages I–IV) (n=55)
Figure 2 Results of cardiopulmonary exercise testing at peak exercise in the various GOLD stages (stages I–IV) (n=55). (A) Expiratory tidal volume at peak exercise in the various GOLD stages. (B) Mean expiratory flow (VT ex/Te) at peak exercise in the various GOLD stages. (C) Breathing frequency (fR) at peak exercise in the various GOLD stages. (D) Minute ventilation (V’E) at peak exercise in the various GOLD stages. (E) Oxygen uptake (V’O2) at peak exercise in the various GOLD stages. **p<0.01 by the Mann–Whitney U-test.
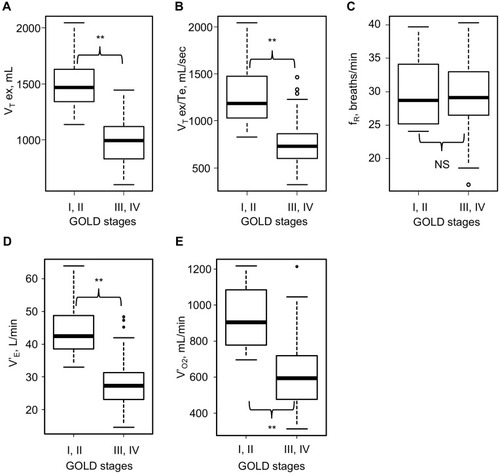
Table 6 Spearman’s Rank Correlation Coefficient Between Parameters of Respiratory Impedance at Rest, Spirometry, and Cardiopulmonary Exercise Testing at Rest (n=55)
Table 7 Spearman’s Rank Correlation Coefficient Between Parameters of Respiratory Impedance at Rest, Spirometry, and Cardiopulmonary Exercise Testing at Peak Exercise (n=55)
Figure 3 Results of univariate analyses and Spearman’s rank correlation coefficient analyses between inspiratory resonant frequency (Fres-ins) at rest and ventilatory parameters of cardiopulmonary exercise testing (CPET) (n=55). In each figure, the graphs on the left show the results of Fres-ins at rest and CPET ventilatory parameters at peak exercise, while those on the right show the results of Fres-ins at rest and ventilatory parameters at rest, respectively. (A) Fres-ins and expiratory tidal volume (VT ex). (B) Fres-ins and mean expiratory flow (VT ex/Te). (C) Fres-ins and breathing frequency (fR). (D) Fres-ins and minute ventilation (V’E). (E) Fres-ins and oxygen uptake (V’O2). *p<0.05; **p<0.01.
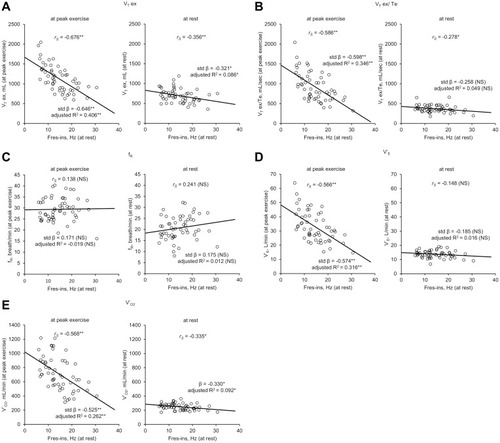
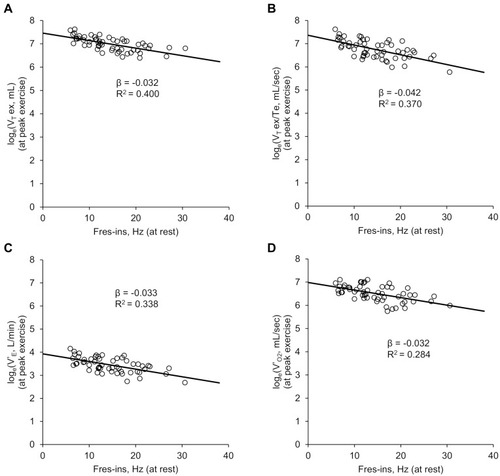
Figure 4 Results of Spearman’s rank correlation coefficient and univariate analyses of the correlation between inspiratory resonant frequency (Fres-ins) at rest and ventilatory parameters of cardiopulmonary exercise testing (CPET) at peak exercise (n=55).Interaction analyses were performed for Fres-ins and natural logarithms of exertional ventilatory parameters of CPET. All the analyses were statistically significant (p<0.01). (A) Fres-ins and expiratory tidal volume (VT ex). (B) Fres-ins and mean expiratory flow (VT ex/Te). (C) Fres-ins and minute ventilation (V’E). (D) Fres-ins and oxygen uptake (V’O2).