
Figures & data
Box 1 Inclusion and Exclusion Criteria
Figure 1 CONSORT diagram showing participant flow through the study.
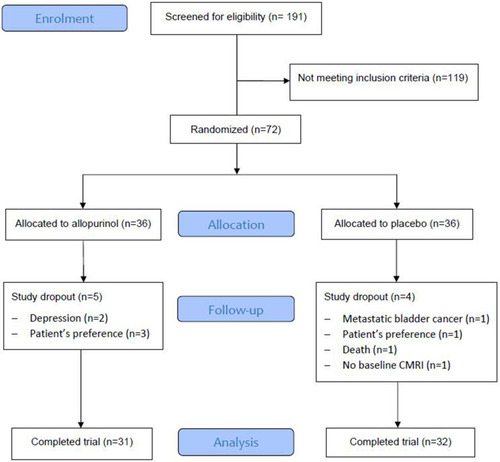
Table 1 Baseline Characteristics of Study Participants
Table 2 Baseline Cardiac MRI Measurements
Table 3 CMRI Changes After Allopurinol Treatment (Intention-to-Treat Analysis)
Table 4 CMRI Changes for RV After Allopurinol Treatment in Subgroup GOLD 3 and 4
Figure 2 Scatter plots of RVM and RVMI (mean and SEM) for overall population (allopurinol n=31, placebo n=32) and subgroup GOLD 3 and 4 (allopurinol n=7, placebo n=13). There were significant (p = 0·02) differences in RVM and RVMI in the subgroup of GOLD 3/4 patients.
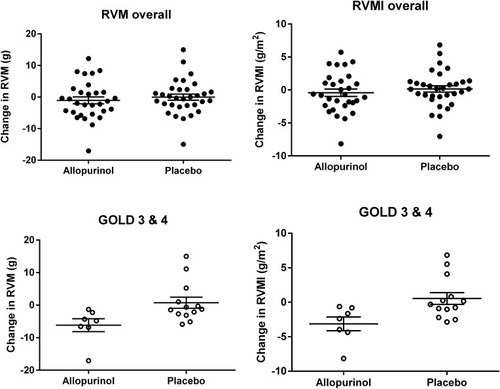
Table 5 Mean Change in Quality-of-Life Scores, Spirometry and Six-Minute Walk Measurements at 52 Weeks Compared to Baseline (Intention-to-Treat Analysis)
Table 6 Mean Change in Blood Markers at 52 Weeks Compared to Baseline (Intention-to-Treat Analysis)