Figures & data
Figure 1 Conceptualization of the SGRQ “Symptoms” domain.
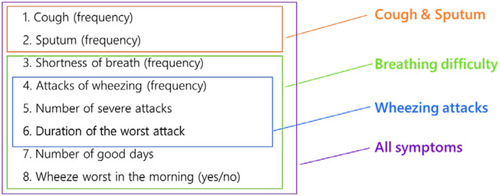
Table 1 Summary of the Demographics of the Samples from the Five Clinical Trials Used for the Rasch Measurement Theory Analysis of the SGRQ in Chronic Obstructive Pulmonary Disease
Table 2 SGRQ “Activity” Domain: Item Fit to the Rasch Model with and without Items 11 and 17 and Differential Item Functioning (DIF) by Geographical Region (Baseline Visits, Pooled Data from 5 Trials, N=7,116)
Figure 2 Person-item distribution of the SGRQ “Activity” domain without items 11 and 17 (Baseline visits, pooled data from 5 trials, N=7,116). The top part of the figure (purple) shows the distribution of impact on activity level in the sample, and the lower part (blue) shows the distribution of impact on activity level in the SGRQ “Activity” domain item thresholds. The blue diamonds corresponds to the “thresholds” between two adjacent item response categories (presented in ).
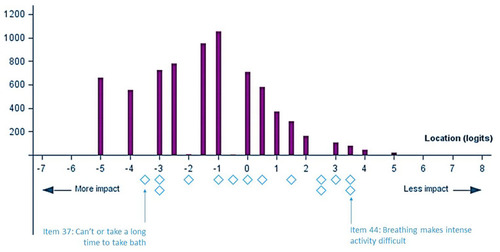
Figure 3 Comparison of SGRQ Activity item location estimates obtained from each trial separately vs obtained from pooled five trials.
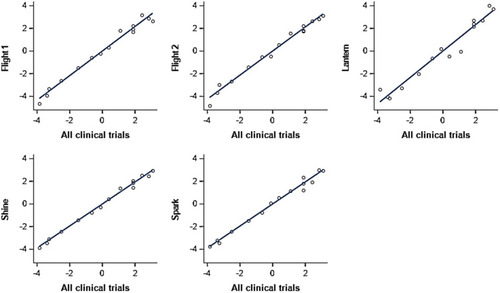
Figure 4 RMT analysis of the SGRQ “Activity” domain without item 11: item hierarchy (Baseline visits from 5 trials, N=7,116).
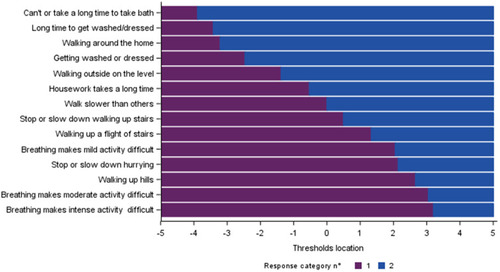
Table 3 SGRQ “Symptoms” Domain: Item Fit to the Rasch Model Before and After Recoding Response Options (Baseline Visits, Pooled Data from 5 Trials, N=7,116)
Figure 5 Person-threshold distribution of the SGRQ “Symptoms” domain after item recoding (Baseline visits from 5 trials, N=7,116). The top part of the figure (purple) shows the distribution of symptoms level in the sample, and the lower part (blue) shows the distribution of symptoms level in the SGRQ ‘Symptoms’ domain item thresholds. The blue diamonds corresponds to the “thresholds” between two adjacent item response categories (presented in ).
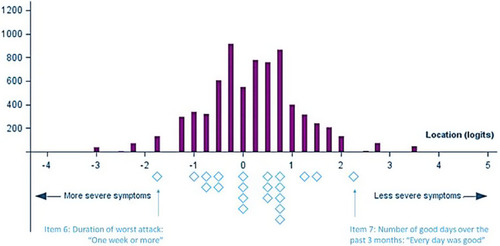
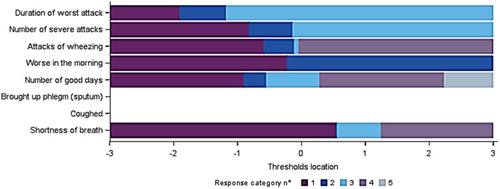
Figure 6 Thresholds map of the SGRQ “Symptoms” domain after item recoding (Baseline visits from 5 trials, N=7,116).