Figures & data
Table 1 Baseline of Atopic and Non-Atopic COPD Patients
Table 2 Immune Factor Levels Between Different Pulmonary Function Groups in Atopic and Non-Atopic COPD Patients
Figure 1 Levels of immune factors between atopic and non-atopic COPD patients. T test: *P<0.05. (A) Levels of MMP8 in atopic COPD patients were higher than in non-atopic COPD patients. But there were no significant difference in (B) MMP9; (C) SPD; (D) NE; (E) LTB4; and (F) PRG4 between atopic COPD patients and non- atopic COPD patients.
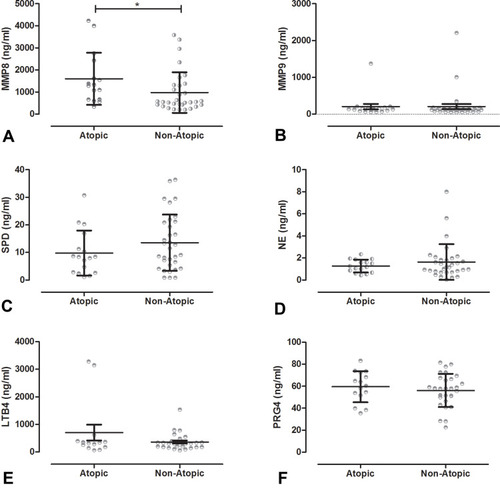
Figure 2 Correlations between the levels of immune factors, tIgE and the rate of white blood cells. Spearman correlation analysis: *P<0.05; **P<0.001. The strongest correlation was between the levels of tIgE and PRG4 in non-atopic COPD patients (rs = 0.63, P <0.05).
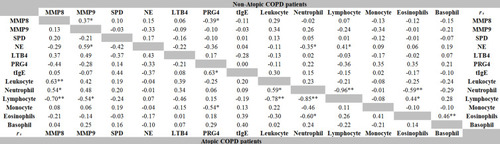
Figure 3 Levels of immune factors in patients with mMRC≥2, CAT≥10, and CCQ≥16. CCQ, Clinical COPD Questionnaire; CAT, COPD Assessment Test; mMRC, Modified Medical Research Council Dyspnea Scale. (A) In atopic COPD patients, there were 3 patients with mMRC≥2, CAT≥10, and CCQ≥16 in the COPD group, and all of them had MMP8 levels ≥1000 ng/mL. (B) In non-atopic COPD patients, 6 cases were complicated with mMRC ≥ 2, CAT ≥ 10, and CCQ ≥ 16, but only 1 case had MMP8 levels ≥1000 ng/mL.
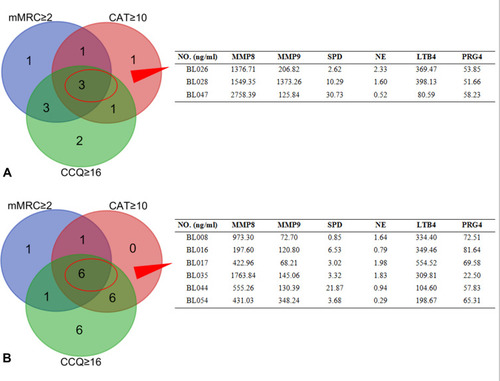
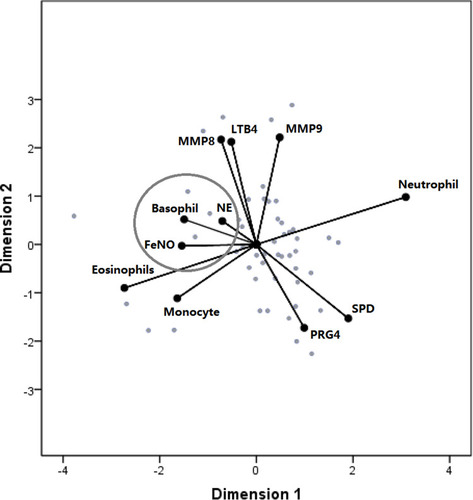
Figure 4 Correlations between immune factor levels, sputum induction, and FeNO. The distance from the point represents their relationship. Optimal scaling analysis showed that there was a correlation between NE levels, basophil rate, and FeNO levels (Cronbach’s alpha = 85.1%).