Figures & data
Table 1 Participant Characteristics and Pulmonary Function Test Measurements
Figure 1 (A–D) Comparisons of (A) ELV180/FRCpleth, (B) ELV180/ELVpred, (C) ELV60/ELV180 and (D) FRCpleth%pred in COPD patients (blue) and healthy participants (red). Long horizontal bar = mean; short horizontal bar = standard deviation; *Statistically significant difference (P<0.05). (E–H) scatterplots of (E) ELV180/FRCpleth, (F) ELV180/ELVpred, (G) ELV60/ELV180 and (H) FRCpleth%pred vs FEV1%pred in COPD patients with a linear regression line in D; r = +0.58 (P<0.05). For definitions see .
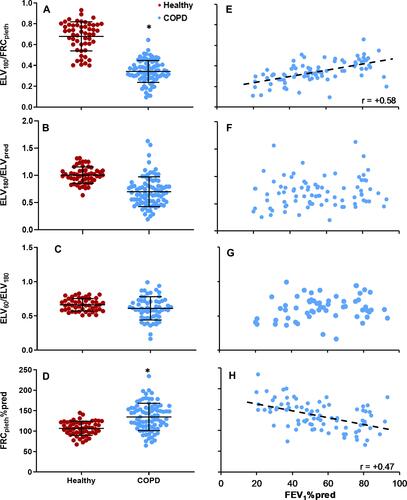
Figure 2 Receiver operator characteristic (ROC) curves for ELV180/FRCpleth, ELV180/FRCpleth % pred and ELV180/ELVpred. When it became apparent that specificity could be improved by normalising ELV180/FRCpleth for age, a ROC curve for the additional parameter ELV180/FRCpleth %pred was constructed.
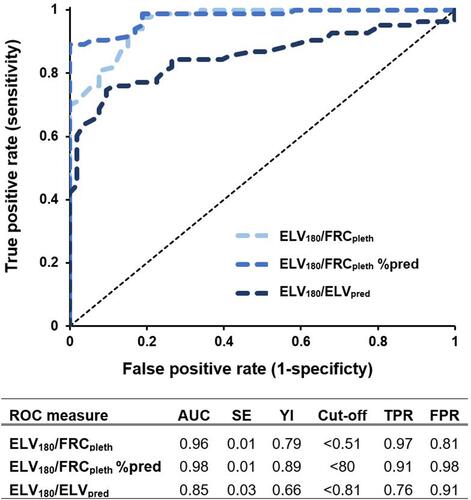
Table 2 Univariable and Multivariable Linear Regression Analysis of ELV180/FRCpleth and ELV180/ELVpred as Predictors of Several Clinical Features (Dependent Variables) of COPD, Independent of FEV1%pred
Figure 3 Scatterplot of ELV180 (L) vs FRCpleth (L) with linear regression lines. Blue = COPD, Red = COPD. COPD, y = 0.19x + 0.59 (R2 = 0.28); Healthy, y = 0.74x – 0.19 (R2 = 0.64).
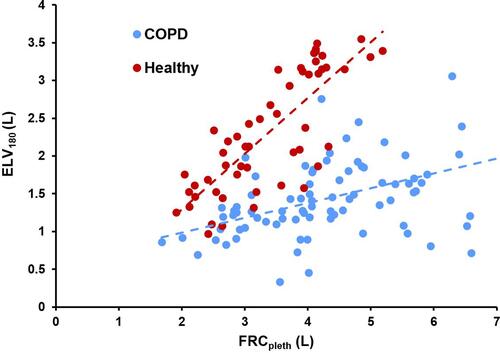
Figure 4 Scatterplots of ELV180/FRCpleth (A and B), ELV180/ELVpred (C and D) and FRCpleth%pred (E and F) with TLCO%pred and CT-derived morphological degree of emphysema (%LAA; low-attenuation area less than –950 Hounsfield units). See for other definitions. Black linear regression lines are shown in A (r = +0.51), B (r = −0.5), C (r = +0.41), D (r = −0.37), and F (r = +0.33) respectively (P<0.05).
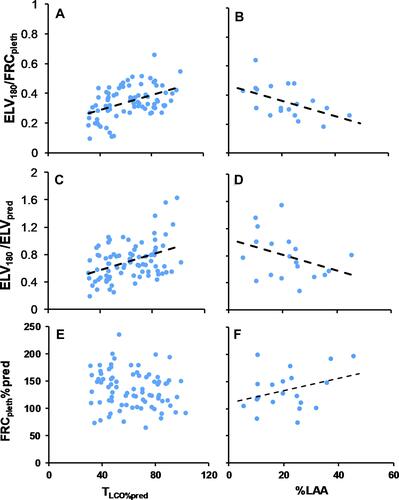
Figure 5 Scatterplots of ELV180/FRCpleth, ELV180/ELVpred and FRCpleth%pred with the COPD assessment test (CAT), and dot plots of ELV180/FRCpleth, ELV180/ELVpred and FRCpleth%pred and the modified Medical Research Council (mMRC) dyspnoea scale and a cough + mucus score derived from the first two question of the CAT (see methods for further details). Scatterplots (A, D and G) include a linear regression line, r = −0.52, r = −0.36 and r = +0.36, respectively (P<0.05). *Statistically significant difference (P<0.05) from mMRC Dyspnoea score = 0/1 (B, E and H) or Cough + Mucus score = 0–3 (C, F and I). †Statistical significant difference (P<0.05) from mMRC Dyspnoea score = 2 (B and E) or Cough + Mucus score = 4–5 (C and F).
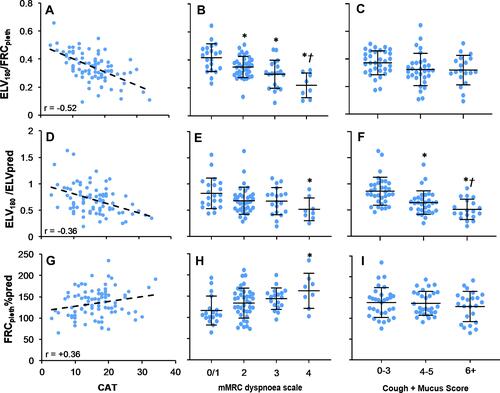
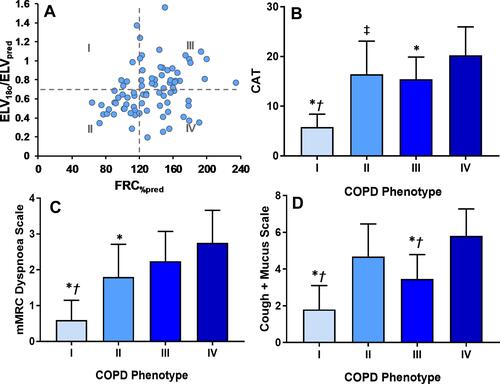
Figure 6 (A) Scatterplot of ELV180/ELVpred vs FRC%pred for COPD patients. Patient data has been additionally categorised into quadrants (“COPD phenotype” I–IV) using the conventionally accepted threshold of lung hyperinflation (FRCpleth%pred = 120%),Citation28 and the lower boundary of normality for ELV180/ELVpred (ie, 2 Z-scores below mean ELV180/ELVpred in healthy participants ≈ 0.7)/Quadrant I, FRC%pleth <120% and ELV180/ELVpred ≥ 0.7; II, FRC%pleth <120% and ELV180/ELVpred < 0.7; III, FRC%pleth ≥120% and ELV180/ELVpred ≥ 0.7; IV, FRC%pleth ≥120% and ELV180/ELVpred < 0.7. See and text for further details. (B–D) Bar charts of the mean (±SD) CAT, mMRC Dyspnoea, and Cough + Mucus scores for each phenotype (I–IV). *Statistical significant difference (P<0.05) from COPD phenotype III. †Statistical significant difference (P<0.05) from COPD phenotype II. ‡Near statistical difference (P=0.09) with COPD phenotype IV.