Figures & data
Table 1 Baseline Characteristics of 10-Year Survivors and Non-Survivors
Figure 1 Kaplan–Meier curve for all-cause mortality for all patients.
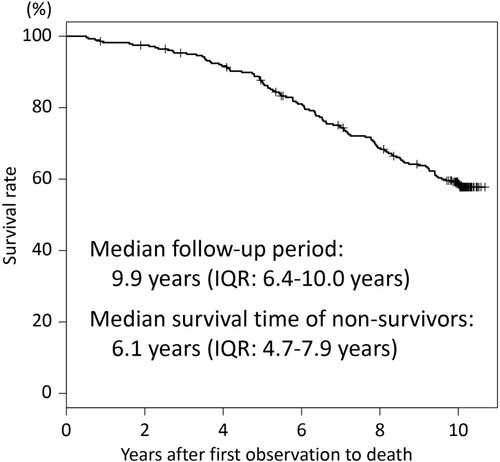
Figure 2 Proportion of causes of death.
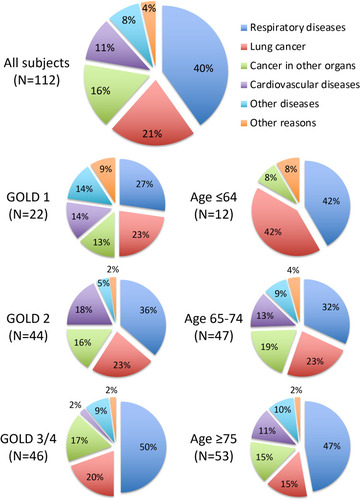
Table 2 Risk Factors of Baseline Variables for All-Cause Mortality (A) and Death from Respiratory Diseases (B)
Table 3 Risk Factors of Longitudinal Variables During the First 5 Years for All-Cause Mortality (A) and Death from Respiratory Diseases During the Last 5 Years (B)
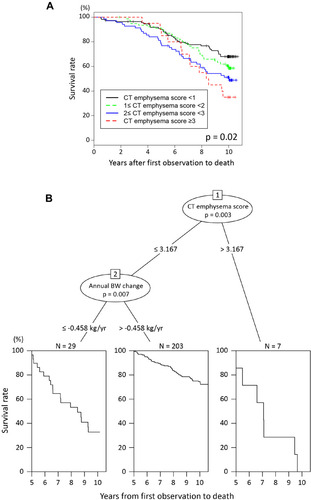
Figure 3 Risk factors for all-cause mortality. (A) Kaplan–Meier curves for all-cause mortality according to the CT emphysema score at baseline. (B) Classification tree produced by CART analysis of risk factors for all-cause mortality during the last 5 years.
Abbreviation: BW, body weight.