
Figures & data
Figure 1 Cause of death according to 2004 GOLD severity classification at baseline.
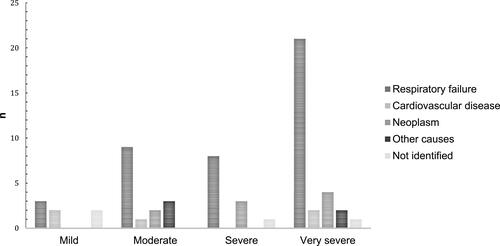
Figure 2 Percentage of eosinophils in relation to total leukocytes.
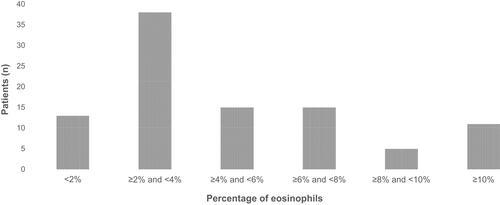
Figure 3 Kaplan–Meier curve in relation to categorizing patients with eosinophils ≥2% (A) and ≥150 cells (B).
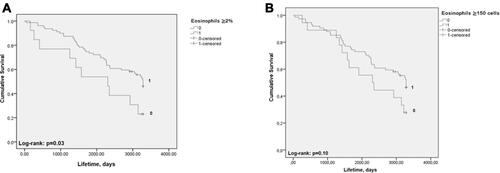
Table 1 Cox Regression Analysis to Evaluate the Association Between Percentage of Eosinophils <2% and Mortality Over Nine Years
Table 2 Cox Regression Analysis to Evaluate the Association Between <150 Eosinophil Cells and Mortality Over Nine Years