Figures & data
Table 1 Criteria for Clinical Control Based on Clinical Criteria or CAT Criteria
Figure 1 STROBE (STrengthening the Reporting of OBservational studies in Epidemiology) diagram of study participants.Citation24
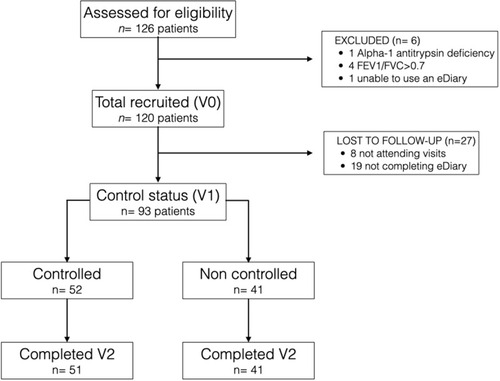
Table 2 Baseline Clinical Characteristics of Participants at V1
Table 3 Impact, Stability and Control During Study Visits (V1 and V2) Among Study Participants According to Clinical or CAT Criteria
Table 4 Changes in Control Status Among Study Participants Between V1 and V2, Either by CAT Criteria or Clinical Criteria
Figure 2 Mean (SE) values of E-RS scores among patients controlled and not controlled (by CAT criteria-left- or by clinical criteria-right) at study visits. *p<0.05.
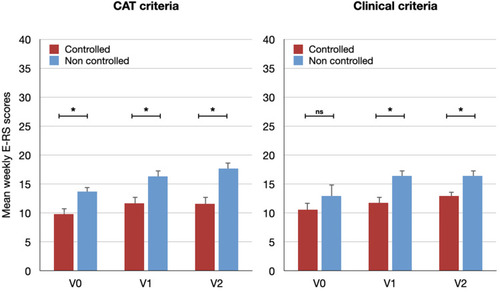
Figure 3 Mean (SE) weekly values of E-RS sub-scales scores (E-RS breath, E-RS cough and E-RS chest) at Visit 2 among controlled and not controlled patients (either by CAT criteria- left- or by clinical criteria-right). *p<0.05.
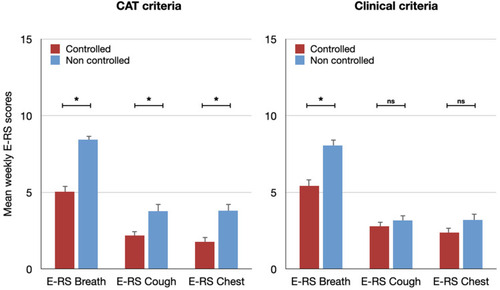
Table 5 Mean Weekly E-RS Scores at V0, V1 and V2 Among Controlled and Not Controlled Patients at V1 by CAT Criteria
Table 6 Mean Weekly E-RS Scores at V0, V1 and V2 Among Controlled and Not Controlled Patients at V1 by Clinical Criteria
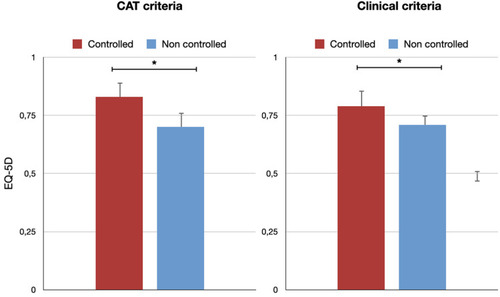
Figure 4 Mean EQ5D values at V2 between controlled and not controlled patients at V2 according to CAT criteria (left) and clinical criteria (right). *p<0.05.