Figures & data
Table 1 miRNA Related Sequences
Table 2 Characteristics of Individuals Enrolled in the Study
Table 3 Comparison of Laboratory Test Data Between the Two Groups [ (S)]
Figure 1 Expression level of miR-1233 (A) and miR-134 (B) in serum of 13 AECOPD+APE patients and matched AECOPD and COPD controls.
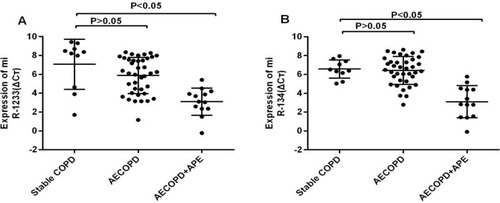
Figure 2 Receiver-operating characteristic (ROC) curve analysis of serum miR-1233, miR-134, plasma D-dimer to discriminate AECOPD+APE patients from AECOPD controls. (A) The analysis showed that the receiver operating characteristic (ROC) area under the curve (AUC) for miR-1233 was 0.884 (95% CI 0.79–0.978)(P<0.05), the AUC for miR-134 was 0.931 (95% CI 0.863–0.999)(P<0.05); (B) the AUC for D-dimer was 0.628 (95% CI 0.447–0.809), the AUC for age-adjusted plasma D-dimer was 0.705 (95% CI 0.525–0.885), and the AUC for Wells score was 0.577 (95% CI 0.389–0.765).
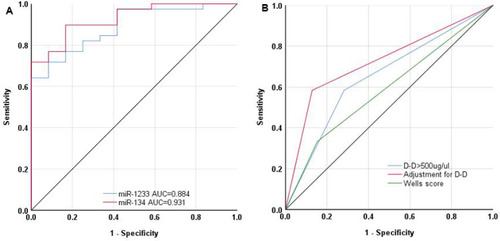
Figure 3 Receiver-operating characteristic (ROC) curve analysis of serum miR-1233, miR-134 combined with plasma D-dimer and Wells score to discriminate AECOPD+APE patients from AECOPD controls. (A) The area under the ROC curve (AUC) of miR-1233 combined with miR-134 was 0.957 (95% CI 0.908–1.000 P<0.05); (B) the AUC for miR-1233+D-dimer was 0.88 (95% CI 0.783–0.977 P<0.05); the AUC for miR-134+D-dimer was 0.936 (95% CI 0.87–1.000, P<0.05); the AUC for D-dimer+Wells was 0.684 (95% CI 0.492–0.876, P<0.05); the AUC for miR-1233+D-dimer+Wells was 0.908 (95% CI 0.815–1.000, P<0.05); the miR-134+D-dimer+Wells was 0.947 (95% CI 0.884–1.000, P<0.05).
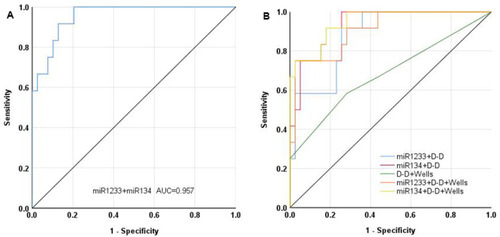
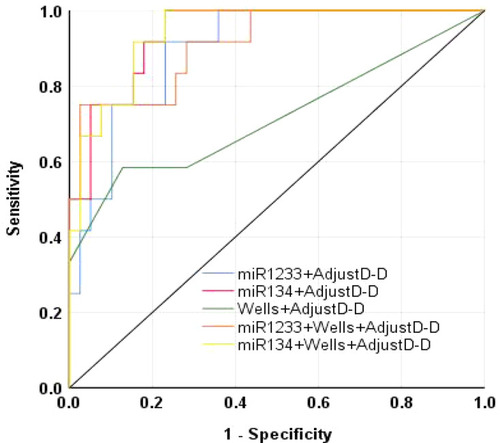
Figure 4 Receiver-operating characteristic (ROC) curve analysis of serum miR-1233, miR-134 combined with age-adjusted plasma D-dimer and Wells score. The area under the ROC curve (AUC) of miR-1233 combined with age-adjusted D-dimer was 0.897 (95% CI 0.81–0.985, P<0.05); the AUC for miR-134+age-adjusted D-dimer was 0.940 (95% CI 0.878–1.000 P<0.05); the AUC for age-adjusted D-dimer+Wells was 0.717 (95% CI 0.521–0.913 P<0.05); the AUC for miR-1233+age-adjusted D-diemer+Wells was 0.912 (95% CI 0.821–1.000 P<0.05); the AUC for miR-134+age-adjusted D-dimer+Wells was 0.942 (95% CI 0.881–1.000 P<0.05).