Figures & data
Figure 1 Odds of COPD by risk factor. Unadjusted odds of COPD by risk factor with 95% CI.
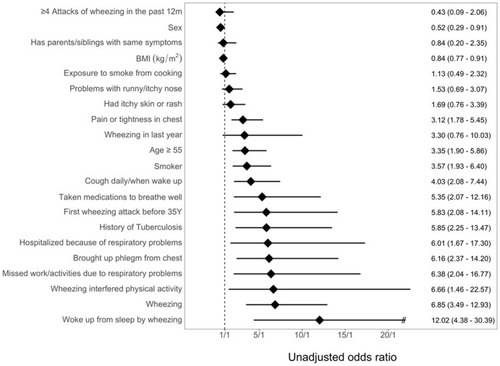
Table 1 Derived COLA Score
Table 2 Baseline Characteristics of 1,173 LiNK Study Participants with Complete Respiratory Symptom Data
Figure 2 Calibration of generated model on test set. Log odds of COPD compared to 5-point respiratory symptom and exposure selection, age and PEF from random forest analysis with best-fit line.
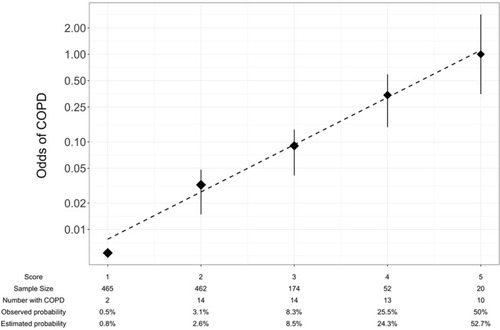
Table 3 Operating Characteristics by COLA Score
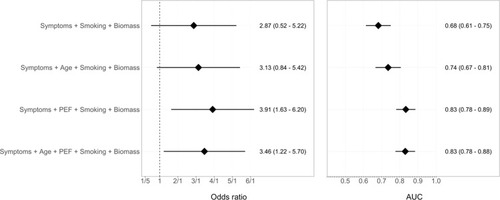
Figure 3 Risk factors for COPD and diagnostic accuracy of demographic and respiratory questionnaires alone, peak expiratory flow (PEF) alone and combined questionnaires with PEF. Odds of COPD (left panel) stratified by age and symptom score, PEF and combined age, symptoms/exposure score and PEF with 95% CI. Area under the curve (AUC) for COPD (right panel) stratified by age and symptom score, PEF and combined age, symptoms score and PEF with 95% CI.