Figures & data
Figure 1 Flowchart of the SCOPE study. At visit 1, patients were screened and written informed consent was obtained. At visit 2, patients were randomly allocated to either the tiotropium/olodaterol or the tiotropium monotherapy group. At visits 3 and 4, patients visited to hospital to verify adherence to bronchodilator treatment and adverse effects. At visit 5, patients were examined for pulmonary function. Patients were fitted and wore an accelerometer for 2 weeks before and after treatments.
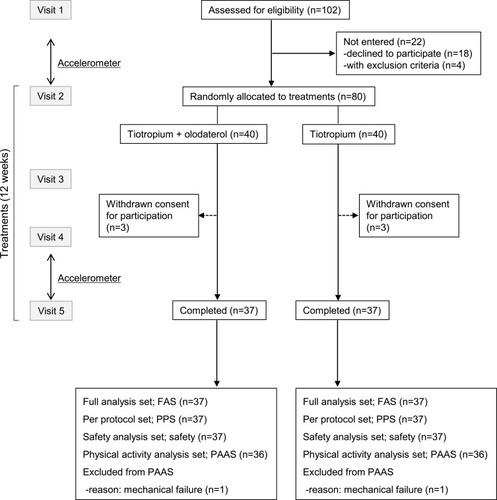
Table 1 Patient Demographics and Characteristics
Table 2 Pulmonary Function Test and Physical Activity at Baseline
Figure 2 Difference in pulmonary function before and after 12 weeks of tiotropium/olodaterol or tiotropium treatment. (A). FEV1, (B). IC, (C). FVC, and (D). VC. Error bars represent standard errors. p values show differences between two groups.
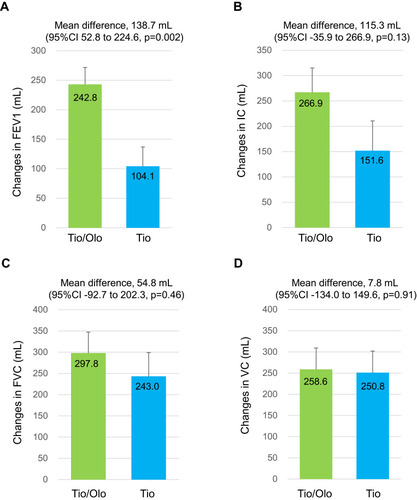
Figure 3 TDI score in tiotropium/olodaterol or tiotropium after the 12-week treatment. Error bars represent standard errors. p values show differences between two groups.
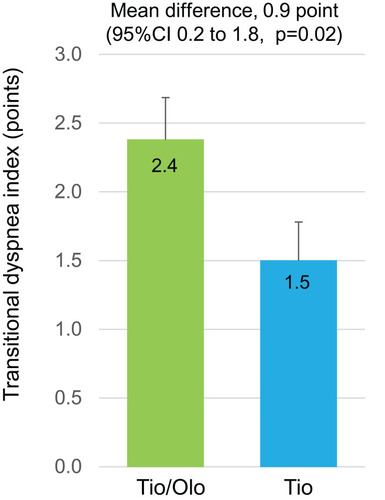
Figure 4 Physical activity after a 12-week treatment with tiotropium/olodaterol or tiotropium. (A). Average daily duration of activity 1.0–1.5 METs. (B) Average daily duration of activity ≥ 2.0 METs. (C). Average daily duration of activity ≥ 3.0 METs. (D). Average number of steps per day. Error bars represent standard errors. p values show differences between two groups.
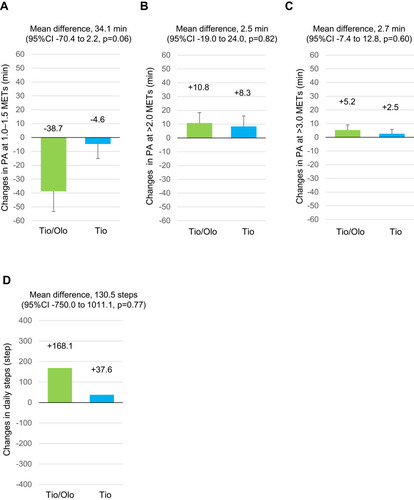
Table 3 Multivariate Analysis of Effect with Tiotropium/Olodaterol versus Tiotropium in Time Spent on 1.0–1.5 METs, ≥2.0 METs and ≥3.0 METs
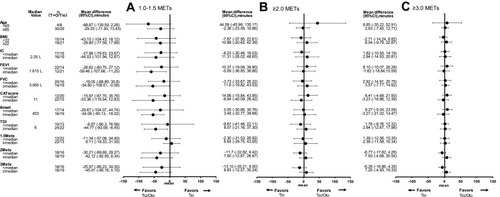
Figure 5 Univariate analysis of tiotropium/olodaterol versus tiotropium with regard to time spent on 1.0–1.5 METs (A), ≥2.0 METs (B), and ≥3.0 METs (C). Physical activity levels (change from baseline) by subgroups are shown by baseline factors including age, BMI, IC, FEV1, FVC, CAT score, 6MWD, TDI, PA 1.0–1.5 METs, PA > 2.0 METs and PA > 3.0 METs.