Figures & data
Figure 1 MVE-induced inflammatory changes and the upregulation of Wnt5a and Ror2 in the lungs of rats.
Notes: (A) H&E staining showed that MVE exposure led to the increase of inflammatory cells and displayed enlarged alveolar space. (B) Immunohistochemical staining showed that the expression of Wnt5a and Ror2 in the lungs tissues was increased in the MVE-exposed rats compared to those exposed to air as controls (original magnification 200×, bar 100 μm). (C) The ODs of Wnt5a and Ror2 positive cells were higher in the MVE-exposed rats compared to those exposed to air as controls. #P<0.05, versus MVE group, n=3.
Abbreviation: MVE, motor vehicle exhaust.
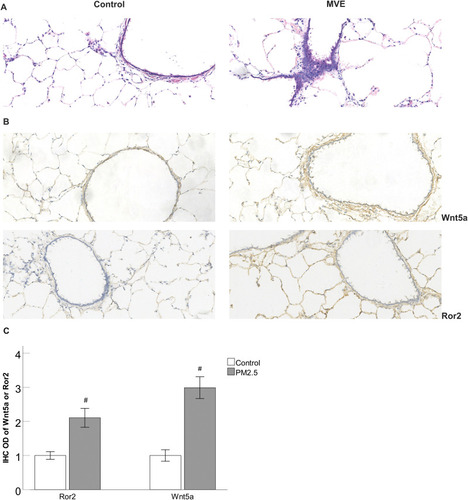
Figure 2 Effect of PM2.5 on viability of the HBECs.
Notes: CCK8 assay showed that the cell viability did not significantly change after 24 h of PM2.5 (5–20μg/mL) exposure, but the cell viability were significantly declined at PM2.5 treatment of 40 μg/mL. #P<0.05, versus PM2.5 group, n=3.
Abbreviation: PM2.5, particulate matter<2.5 μm.
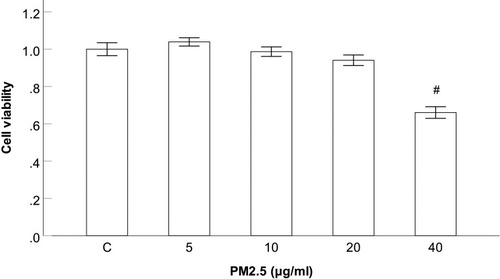
Figure 3 Wnt5a and Ror2 expression is induced by PM2.5 stimulation in HBECs.
Notes: (A) Western blot showed that Wnt5a production did not significantly change after 24 h of PM2.5 (5–10 g/mL) exposure, but the production were significantly increased at PM2.5 treatment of 20 μg/mL. (B) Real-time PCR results showing the dramatic upregulation of Wnt5a mRNA and Ror2 mRNA after 24 h of 20 μg/mL PM2.5 stimulation. (C) Western blot showed that Wnt5a and Ror2 protein expression did not significantly change after 3 h and 12 h of 20 μg/mL PM2.5 stimulation, but the expression were significantly increased after 24 h of 20 μg/mL PM2.5 exposure. #P<0.05, versus control group. n=3.
Abbreviation: PM2.5, particulate matter<2.5 μm.
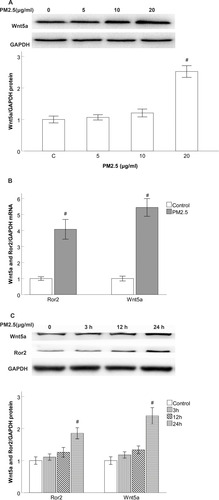
Figure 4 Wnt5a knockdown reduced Ror2 expression in PM2.5-exposed HBECs.
Notes: Western blot showed that Wnt5a siRNA blocked the expression of Wnt5a and Ror2 in PM2.5-exposed HBECs. #P<0.05, versus control group. *P<0.05, versus PM2.5 group, n=3.
Abbreviations: PM2.5, particulate matter<2.5μm; siRNA, small interfering RNA.
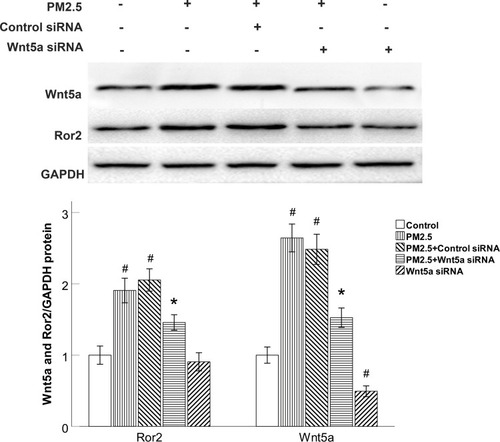
Figure 5 The NF-κB activity was regulated by Wnt5a/Ror2 signaling in PM2.5-exposed HBECs.
Notes: (A) Western blot showed that Wnt5a siRNA led to increased cytoplasmic accumulation and inhibited nuclear translocation of NF-κB in PM2.5-exposed HBECs. (B) Western blot showed that Ror2 siRNA suppressed the Ror2 protein expression in PM2.5-exposed HBECs. (C) Western blot shows that Ror2 siRNA led to increased cytoplasmic accumulation and inhibited nuclear translocation of NF-κB in PM2.5-exposed HBECs. #P<0.05, versus control group. *P<0.05, versus PM2.5 group, n=3.
Abbreviations: PM2.5, particulate matter<2.5μm; siRNA, small interfering RNA.
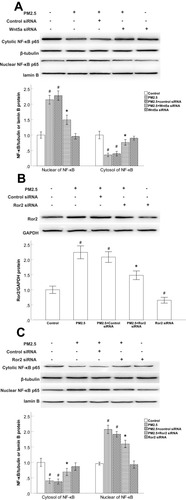
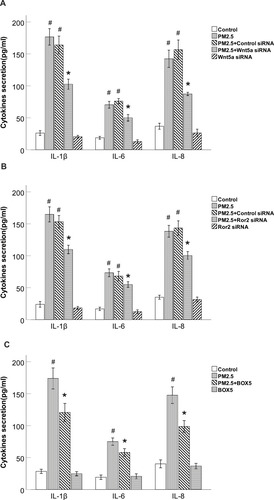
Figure 6 PM2.5 increased IL-6, IL-8 and IL-1β production through Wnt5a/Ror2 signaling in HBECs.
Notes: (A) ELISA results showed that Wnt5a siRNA decreased PM2.5-induced IL-6, IL-8 and IL-1β production in HBECs. (B) ELISA results showed that Ror2 siRNA decreased PM2.5- induced IL-6, IL-8 and IL-1β production in HBECs. (C) ELISA results showed that BOX5 decreased PM2.5-induced IL-6, IL-8 and IL-1β production in HBECs. #P <0.05, versus control group. *P<0.05, versus PM2.5 group, n=3.
Abbreviations: PM2.5, particulate matter<2.5μm; siRNA, small interfering RNA.