Figures & data
Table 1 Baseline Characteristics of Probands
Figure 1 Frequency of 18,736 patients among chronic respiratory disorders without consideration on AATD. A three-way Venn diagram was plotted to investigate the relationship between patients of COPD/Emphysema, asthma and bronchiectasis and their overlaps. COPD/Emphysema only: 12,283 (65.56%); asthma only: 4,041 (21.57%); bronchiectasis only: 285 (1.52%); COPD/Emphysema and asthma overlap: 1,592 (8.50%); COPD/Emphysema and bronchiectasis overlap: 345 (1.84%); asthma and bronchiectasis overlap: 92 (0.49%); COPD/Emphysema and asthma and bronchiectasis overlap: 98 (0.52%). BioVenn – a web application for the comparison and visualization of biological lists using area-proportional Venn diagrams. T. Hulsen, J. de Vlieg and W. Alkema, BMC Genomics 2008, 9 (1): 488.
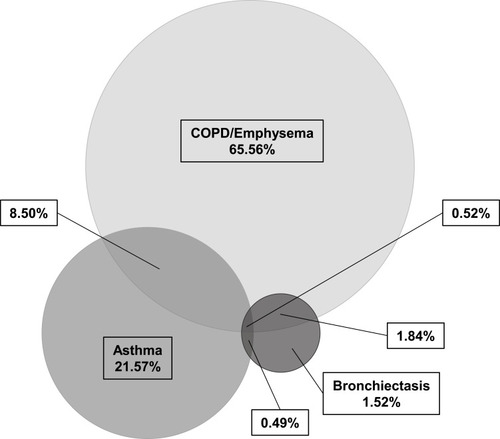
Figure 2 Frequency of symptoms among the chronic respiratory diseases: COPD/emphysema, asthma and bronchiectasis. Figure 2 displays the frequency of clinical symptoms (dyspnea, dyspnea attacks, cough, phlegm, wheezing, acute bronchitis and chronic bronchitis) among the chronic respiratory diseases (COPD/emphysema, asthma and bronchiectasis). Chi-square test was used for statistical analyses. This information has been evaluated on the basis of the information on the AlphaKits®. Dyspnea appeared most frequently in patients with COPD/emphysema, whereas dyspnea attacks were more often in patients with asthma. Cough and phlegm could be observed most frequently in patients with bronchiectasis. Acute and chronic bronchitis occurred more often in patients with asthma or bronchiectasis than in patients with COPD/emphysema. ###p<0.001 significant between bronchiectasis and asthma; §§§p<0.001, §p<0.05 significant between bronchiectasis and COPD/emphysema; ***p<0.001, **p<0.01 significant between asthma and COPD/emphysema.
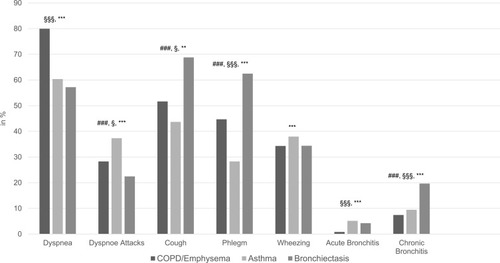
Figure 3 Distribution of the AAT alleles.
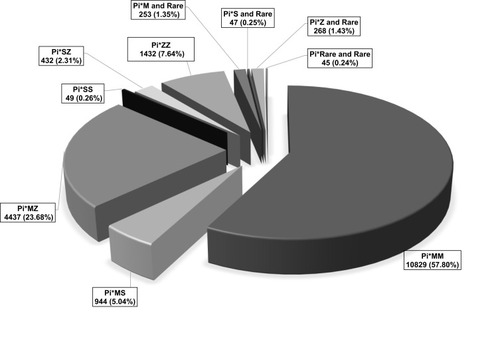
Table 2 Distribution of the AAT Alleles Among Patients with COPD/Emphysema or Asthma, or Bronchiectasis
Figure 4 Distribution of AAT alleles among the chronic respiratory diseases: COPD/emphysema, asthma and bronchiectasis. Figure 4 displays the distribution of AAT alleles among the chronic respiratory diseases bronchiectasis, asthma and COPD/emphysema. The distribution of the wild type (Pi*MM) was roughly comparable between the three groups (significant only between asthma and COPD/emphysema). The same applied to the distribution of the genotypes Pi*MS, Pi*M/rare and Pi*Z/rare, while the genotypes Pi*SS, Pi*SZ and Pi*S/rare were not distributed significantly different. A higher percentage of asthma patients exhibited the Pi*MZ genotype, whereas more COPD/emphysema and bronchiectasis patients exhibited the Pi*ZZ genotype when compared to asthma patients. ###p<0.001, ##p<0.01 significant between bronchiectasis and asthma; ***p<0.001, *p<0.05 significant between asthma and COPD/emphysema.
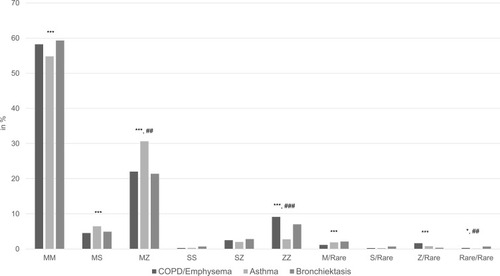
Table 3 Distribution of AAT Alleles Among Different Combinations of the Three Diagnostic Groups
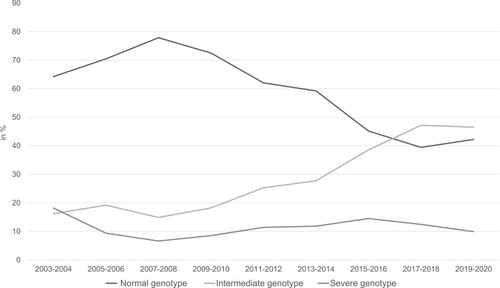
Figure 5 Detection rate of patients with COPD/emphysema, bronchiectasis, asthma.