Figures & data
Table 1 Basic Information of Patients in COPD Group and Control Group
Figure 1 Rcn3 expression in lung tissues from COPD patients. A total of 70 specimens were divided into COPD group and Control group according to the pulmonary function test and pathological changes of emphysema. (A) Photomicrography of pulmonary parenchyma stained with H&E (upper panels). Bar size: 100 μm; IHC assays of Rcn3 from COPD group lungs and Control group lungs (low and high magnifications, lower panels). Bar size: 100 μm; (B) The MLI analysis of H&E stained lung sections (82.78 ± 9.417 μm vs.104.8 ± 5.789 μm, n = 21 in Control group and n = 34 in COPD group, p<0.05); (C) Quantification of the mean optical density of Rcn3 expression in the lung tissues according to the Rcn3 IHC assays (3 random views, 100× amplification for one subject, n = 11–12 per group, p<0.05); (D) Qualitative PCR analyses of the mRNA expressions of Rcn3 and GRP78; the data were normalized to the GAPDH content and were analyzed by the 2−ΔΔCt method relative to the Control group; n = 6 in Control group and n = 10 in COPD group; (E) The protein levels of Rcn3 and GRP78 were examined by Western blot analysis and the ratios to Actin presented by bar graph; n = 6 in Control group and n = 10 in COPD group. Data presented as mean ± SEM; *p<0.05 versus the Control group.
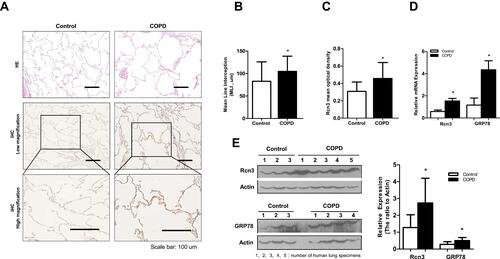
Figure 2 Rcn3 expression in lung tissues from CS-induced mouse model of emphysema. A total of 16 C57BL/6 mice (6 weeks old) were exposed to cigarette smoke for 6 months as emphysema mice (CS group) and 16 C57BL/6 mice were exposed to air for 6 months as Control mice (Control group). (A) Photomicrography of pulmonary parenchyma stained with H&E (upper panels). Bar size: 100 μm; IHC assays of Rcn3 (low and high magnifications, lower panels). Bar size: 50 μm; (B) Morphometric analysis of the MLI ((44.00 ± 2.528 μm vs.56.81 ± 3.053 μm, n = 16 per group, p<0.01); (C) The mean optical density of Rcn3 expression was measured in the lung tissues according to the Rcn3 IHC assays (3 random views, 100× amplification for one subject, n = 16 per group, p<0.01); (D) Representative WB for protein levels of Rcn3, GRP78 and Cleaved caspase-3 in lungs and the ratios to β-Tubulin presented by bar graph, n = 8 per group; (E) Expressions of Rcn3 and GRP78 mRNA were determined with Qualitative PCR analysis, n = 9–10 per group. Data presented as mean ± SEM; *p<0.05, **p<0.01 versus the Control group.
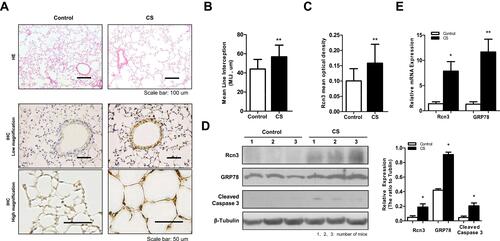
Figure 3 Rcn3 expression in lung tissues from the elastase-induced mouse model of emphysema. (A) Lungs after saline or PPE instillation at 0.2 U, 0.3 U and 0.4 U/per mouse were compared in H&E-stained tissue sections. Bar size: 100 μm; (B) The MLI analysis of lung sections after saline or PPE instillation (40.58 ± 0.53 μm, 56.10 ± 2.45 μm, 98.23 ± 3.21 μm and 71.22 ± 2.84 μm, respectively, n = 5 per group); (C) The PPE instillation induced the protein expressions of Rcn3, GRP78, Cleaved caspase-3, and the ratios to β-Tubulin expression are represented by graphs, n = 5 per group; (D) Qualitative PCR analysis of the mRNA expressions of Rcn3, GRP78, Collagen I (Col (I) and MMP-9 in the lungs at 4 weeks after PPE (0.3 U/per mouse) or saline treatment, n = 5 per group. Data presented as mean ± SEM; *p<0.05, **p<0.01, ***p<0.001, versus the Saline group, ###p<0.001, versus the 0.3 U PPE group.
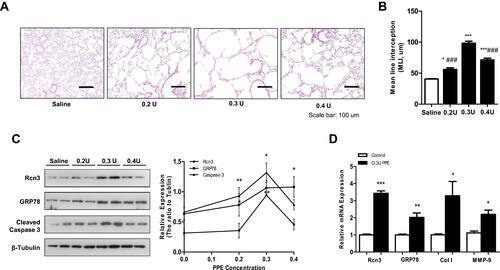
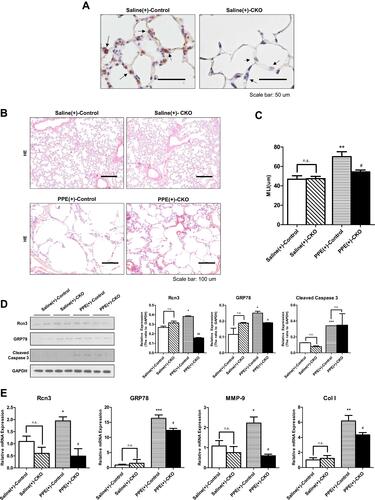
Figure 4 The selective deletion of Rcn3 in AECIIs alleviated elastase-induced emphysema. (A) IHC assays of Rcn3 from lungs in saline-treated WT mice or saline-treated CKO mice (arrows indicate the corners of alveoli, suggestive of AECIIs). Bar size: 50 μm; (B) H&E staining of lung tissues from mice in Saline(+)-Control, Saline(+)-CKO, PPE(+)-Control and PPE(+)-CKO groups. Bar size: 100 μm; (C) The MLI analysis of lung sections from the four groups of mice (46.85 ± 3.56 μm, 47.45 ± 2.268 μm, 70.07 ± 5.067 μm, and 54.34 ± 1.977 μm, respectively, n = 9–10 per group); (D) The protein levels of Rcn3, GRP78 and Cleaved caspase-3 in Saline(+)-Control, Saline(+)-CKO, PPE(+)-Control, and PPE(+)-CKO mice were examined by Western blot analysis and the ratios to GAPDH presented by bar graph, n = 5 per group; (E) Qualitative PCR analysis of the mRNA expressions of Rcn3, GRP78, MMP-9, and Collagen I in Saline(+)-Control, Saline(+)-CKO, PPE(+)-Control, and PPE(+)-CKO mice, n = 5 per group. Data presented as mean ± SEM; *p<0.05, **p<0.01, ***p<0.001, versus Saline(+)-Control group; #p<0.05, ##p<0.01, versus PPE(+)-Control group.