Figures & data
Table 1 Characteristics of the Study Patients (n=182)
Figure 1 Inflammatory biomarkers levels in COPD and ACO.
Notes: (A) FeNO levels; (B) EOS levels; (C) NLR levels. All of them are shown as medians (interquartile range). Mann–Whitney U-test were used to assess the differences between groups. P<0.05 indicates statistical significance.
Abbreviations: FeNO, fractional exhaled nitric oxide; EOS, blood eosinophils count; NLR, neutrophil to lymphocyte ratio; ICS, inhaled corticosteroids.
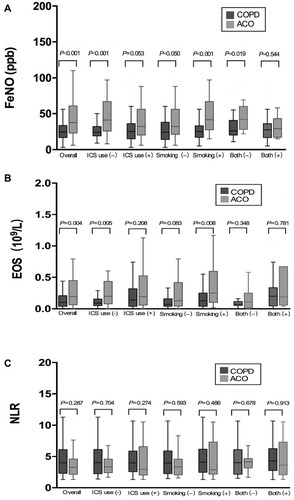
Figure 2 Correlation of FeNO with EOS in patients with ACO.
Notes: (A) overall patients; (B) patients without ICS use; (C) patients with ICS use; (D) patients without smoking history; (E) patients with smoking history. P<0.05 indicates statistical significance.
Abbreviations: FeNO, fractional exhaled nitric oxide; EOS, blood eosinophils count; NLR, neutrophil to lymphocyte ratio; ICS, inhaled corticosteroids.
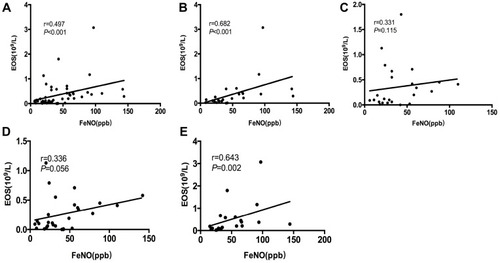
Figure 3 Correlation of inflammatory biomarkers with FEV1%pred in patients with ACO.
Notes: (A) FeNO with FEV1%pred; (B) EOS with FEV1%pred; (C) NLR with FEV1%pred; P<0.05 indicates statistical significance.
Abbreviations: FeNO, fractional exhaled nitric oxide; EOS, blood eosinophils count; NLR, neutrophil to lymphocyte ratio.
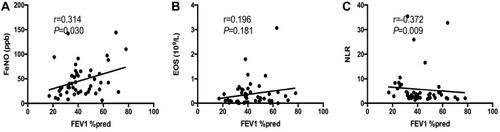
Table 2 Diagnostic Accuracy of Inflammatory Biomarkers
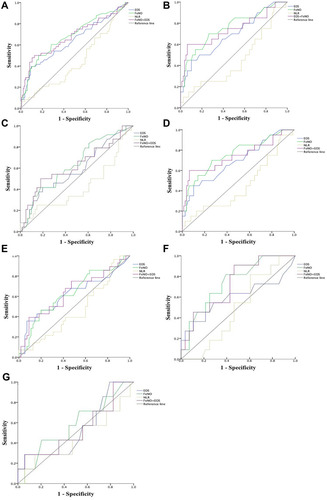
Figure 4 ROC curve for inflammatory markers for differentiating ACO from COPD.
Notes: (A) overall patients; (B) patients without ICS use; (C) patients with ICS use; (D) patients with smoking history; (E) patients without smoking history; (F) patients without smoking and ICS use history; (G) patients with smoking and ICS use history.
Abbreviations: FeNO, fractional exhaled nitric oxide; EOS, blood eosinophils count; NLR, neutrophil to lymphocyte ratio; ICS, inhaled corticosteroids.