Figures & data
Figure 1 The measurement point of lung movement in our study.
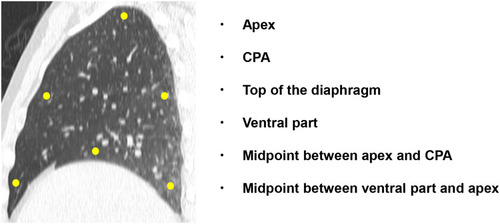
Table 1 Characteristics of COPD Patients and Patients with Asthma
Table 2 Displacement of COPD Patients and Patients with Asthma
Table 3 Velocity During Inhalation of COPD Patients and Patients with Asthma
Table 4 Velocity During Exhalation of COPD Patients and Patients with Asthma
Table 5 Characteristics of COPD Patients with Mild Emphysema and Patients with Asthma
Table 6 Displacement of COPD Patients with Mild Emphysema and Patients with Asthma
Table 7 Velocity During Inhalation of COPD Patients with Mild Emphysema and Patients with Asthma
Table 8 Velocity During Exhalation of COPD Patients with Mild Emphysema and Patients with Asthma
Figure 2 A series of box-plots showing displacement of the ventral point of the right lung. (A) A box-plot of COPD. (B) A box-plot of asthma. It demonstrates greater alteration for displacement in asthma patients, compared with COPD patients. Box plots of measurement of displacement and velocity value in abdominal part of the lung. “Displacement” means the amount of movement of the interest target voxel which move from the initial phase. “Velocity” means the amount of velocity of the interest target voxel which move from the previous phase. X axis is the one respiratory phase starting from the level of peak inspiratory phase. The X-axis represents one respiratory cycle, and this is a reconstruction of one breath into 28 phases bin starting from the peak inspiratory phase. The Y-axis represents “displacement” and “velocity”, and is a measurement at each respiratory phase for each patient group.
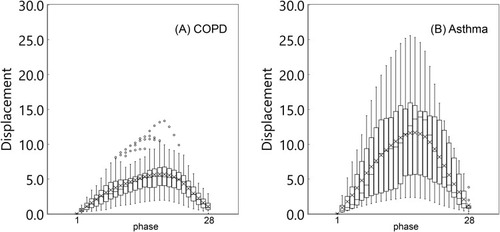
Figure 3 A series of box-plots showing velocity of the ventral point of the right lung. (A) A box-plot of COPD. (B) A box-plot of asthma. It demonstrates greater alteration for velocity in asthma patients, compared with COPD patients.
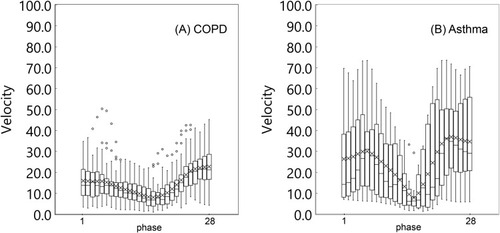
Figure 4 A series of box-plots showing displacement of the ventral point of the left lung. (A) A box-plot of COPD. (B) A box-plot of asthma. It also demonstrates greater alteration for displacement in asthma patients, compared with COPD patients.
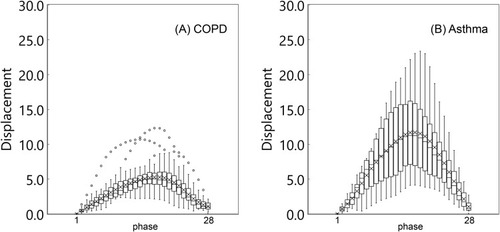
Figure 5 A series of box-plots showing velocity of the ventral point of the left lung. (A) A box-plot of COPD. (B) A box-plot of asthma. It also demonstrates greater alteration for velocity in asthma patients, compared with COPD patients.
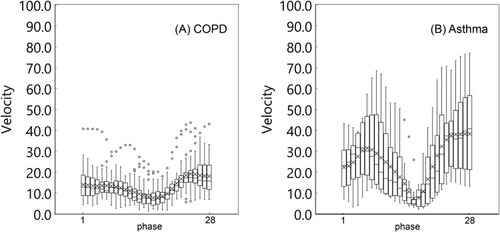
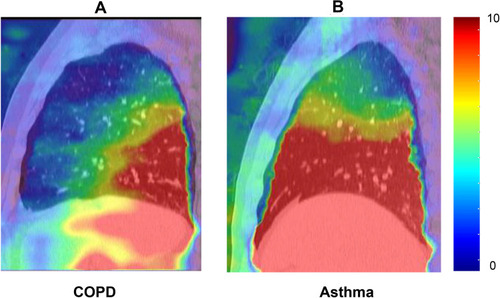
Figure 6 Typical movement of the lung. The amount of local lung movement was quantified and displayed as “displacement map”. The local lung movement in COPD patients were significantly smaller than those in asthma patients especially in the ventral part of the lung. Color wash range: displacement: 0–10. (A) A typical movement of COPD. (B) A typical movement of asthma.