
Figures & data
Figure 1 Consort diagram of the study population.
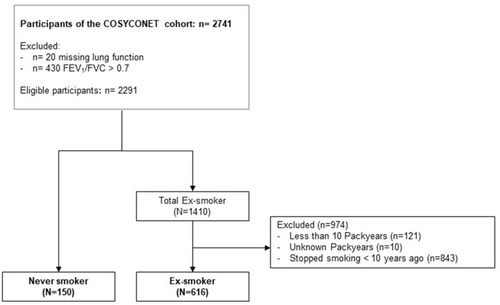
Table 1 Baseline Characteristics of the Study Sample Stratified by Smoking Status
Table 2 Mean Household Net Income per Month in Euro by Level of Education
Table 3 Mean Values of Parameters by Smoking Status and Education
Figure 2 Mean values of lung function parameters by smoking status and by education. Multiple ANOVA models (A–D) were adjusted for age, sex, body mass index (BMI), years since COPD diagnosis, and smoking status*education. Education was categorized as basic education (≤9 years), secondary education (10–11 years), and higher education (>11 years).
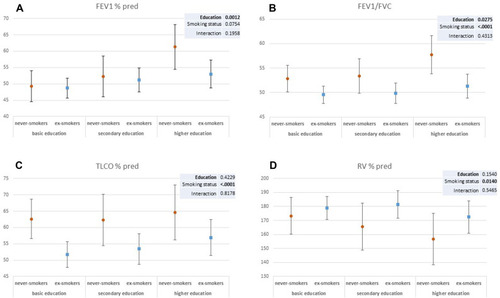
Figure 3 Mean values of health-related quality of life and exercise capacity by smoking status and by education. Multiple ANOVA models (A–C) were adjusted for age, sex, body mass index (BMI), years since COPD diagnosis, and smoking status*education. Education was categorized as basic education (≤9 years), secondary education (10–11 years), and higher education (>11 years).
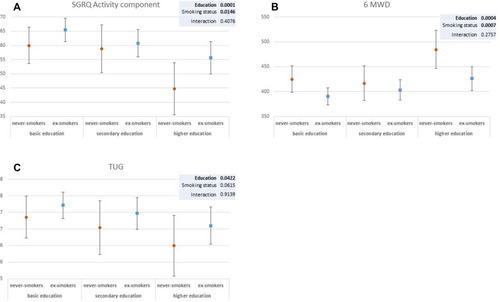
Table 4 Association Between Comorbidities, Smoking Status, and Education