Figures & data
Table 1 The nine aspects of the COPE-active program, with number of items per aspect, the score per item, and the maximum score per aspect
Figure 1 Flow diagram of patient progress through the COPE II-study.
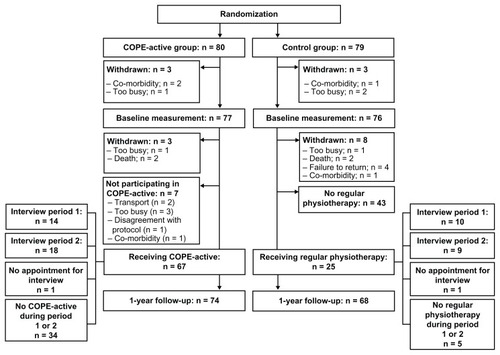
Figure 2 The median, 25th and 75th percentile of total scores and outliers (*) of patients receiving regular physiotherapy and COPE-active in two different time periods within the COPE-II study.
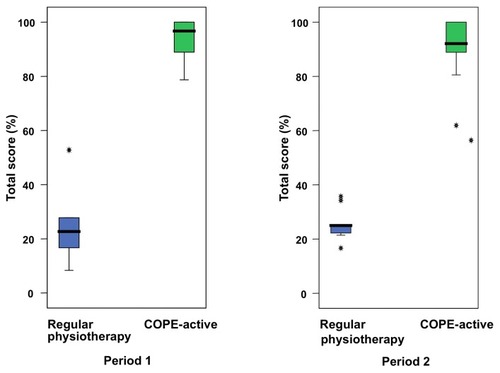
Figure 3 Individual patient’s scores of the COPE-active group (○) and the group receiving regular physiotherapy (△) per physiotherapist.
Notes: Seven physiotherapists (1, 4, 5, 6, 7, 11, and 12) trained patients of both study groups and three physiotherapists were not participating in the COPE-II study (13, 17, and 18). In four cases two patients trained by the same physiotherapist had exactly the same score (*).
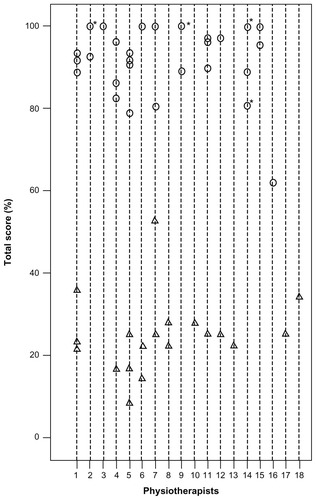
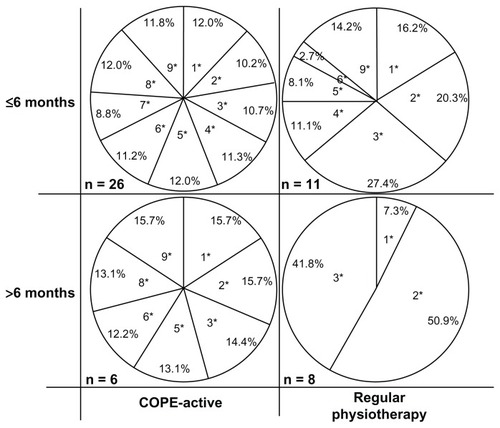
Figure 4 Relative contribution (%) of each of the nine aspects constituting the (mean) COPE-active score, for both the COPE-active patients and those receiving regular physiotherapy.
Notes: Data are divided in patients receiving less than six months (maximal contribution of 9 items) and more than six months (maximal contribution of 7 items) of physiotherapy. *(1) Number of physiotherapeutic sessions per week; (2) duration of a physiotherapeutic session; (3) type of exercises in physiotherapeutic sessions; (4) increasing intensity of physiotherapeutic sessions; (5) number of exercise sessions at home; (6) type of exercises at home; (7) increasing intensity of exercises at home; (8) number of repeating sessions in training; (9) use of Borg-scores.