Figures & data
Figure 1 Model structure.
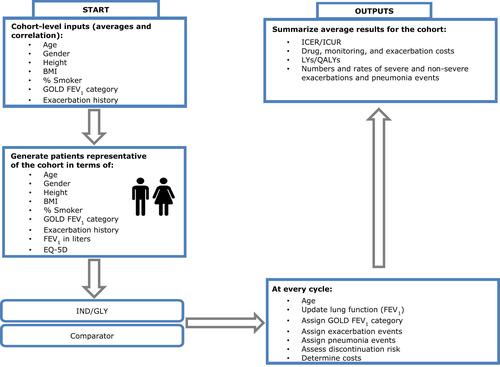
Table 1 Baseline Characteristics of Two Trial Cohort
Table 2 FEV1 in Liters Improvement in Two Cohorts
Table 3 Results of Whole Life Simulation of IND/GLY vs SAL/FLU
Figure 2 Probability sensitivity analysis of IND/GLY vs SAL/FLU. We showed the results of probability sensitivity analysis (PSA) of IND/GLY vs SAL/FLU in this scatter plot. Each scatter represents an iteration in this model with different incremental costs and QALYs in PSA. This figure showed in most iterations, IND/GLY is with lower costs and longer QALYs than SAL/FLU. We concluded that IND/GLY is with dominate cost-effectiveness than SAL/FLU.
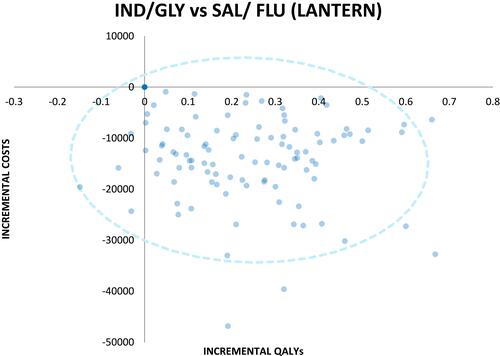
Table 4 Results of Whole Life Simulation of IND/GLY vs Tiotropium
Figure 3 Probability sensitivity analysis of IND/GLY vs tiotropium. We showed the results of probability sensitivity analysis (PSA) of IND/GLY vs tiotropium in this scatter plot. Each scatter represents an iteration in this model with different incremental costs and QALYs in PSA. As IND/GLY can bring longer QALYs but cost more. We need to figure out the probability of scatters to be cost-effective under different threshold.
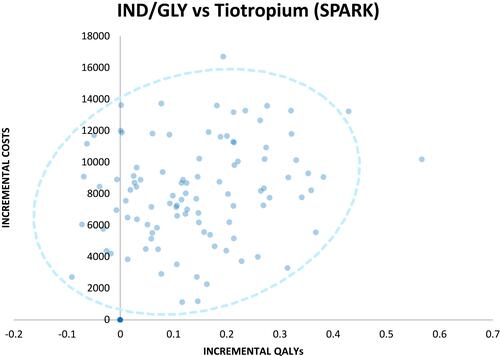
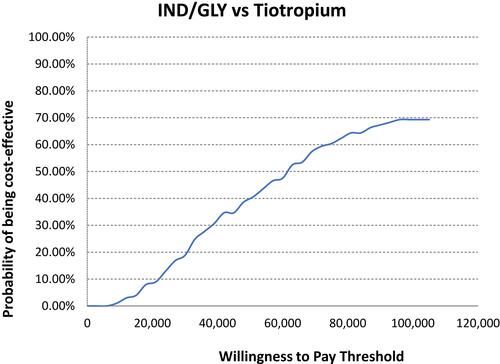
Figure 4 The probability of being cost-effective in PSA of IND/GLY vs tiotropium. This figure showed the probability of iterations in PSA being accepted as cost-effective under different threshold. In our study, we selected 70,000 CNY as willingness-to-pay threshold as we mentioned fully in Method section. We can see the probability of cost-effectiveness of IND/GLY comparing with tiotropium is 50–60%.