Figures & data
Figure 1 Lung function and Lung histomorphological. (A) Forced expiratory volume (FEV) and (B) expiratory resistance (Re) of each group. (C) Mean linear intercept (Lm) (Scale bar=100 µm) and (D) destructive index (DI) (Scale bar=50 µm) of each group. (E–F) Hematoxylin and eosin staining of rat lung tissue in each group. Arrows indicate inflammatory cell infiltration. Data presented as mean ± SD (n=6 per group). * P <0.05; ** P <0.01; *** P <0.001.
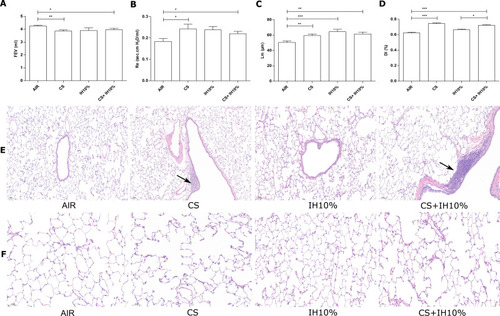
Figure 2 Changes of bone microarchitecture revealed by microcomputed tomography. (A) Three-dimensional reconstruction of cortical bones (upper) and trabecular bones (lower) of the femur. (B) The length of femoral in each group. Quantitative analyses of parameters including: (C) percent bone volume (BV/TV), (D) trabecular thickness (Tb.Th), (E) trabecular number (Tb.N), (F) trabecular separation (Tb.Sp), (G) cortical bone thickness (Ct.Th), (H) bone mineral density (BMD). Data presented as mean ± SD (n=5 per group). * P <0.05; ** P <0.01.
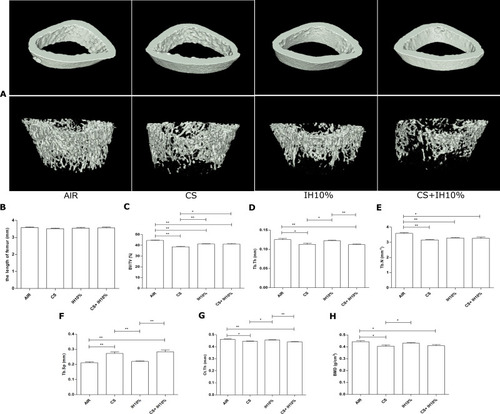
Figure 3 TRAP staining and quantitative analyses of osteoclasts in femoral tissues. (A) TRAP staining of femoral tissues in each group (Scale bar=50 µm). TRAP-positive osteoclasts were stained red, and the nuclei were light blue. Arrows indicate TRAP-positive osteoclasts. (B) Numbers of TRAP-positive osteoclasts, measured as cells per millimeter of perimeter (cells/B.Pm). Data presented as mean ± SD (n=5 per group). * P <0.05; *** P <0.001.
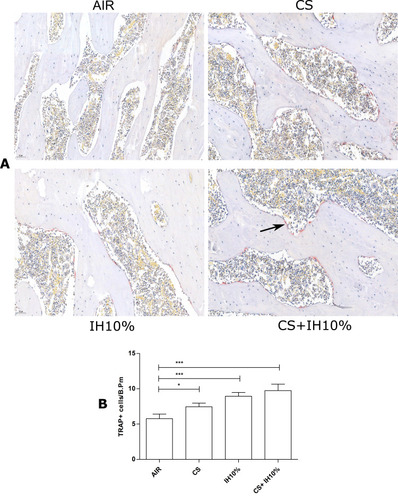
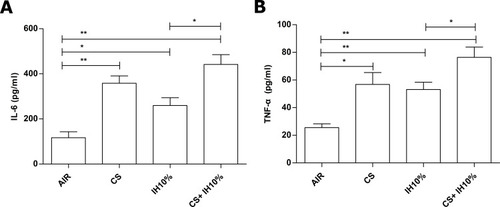
Figure 4 Concentration of IL-6 and TNF-α in peripheral blood of each group. Levels of serum (A) IL-6 and (B) TNF-α were measured with ELISA. Data presented as mean ± SD (n=5 per group). * P <0.05; ** P <0.01.