Figures & data
Table 1 Clinical Characteristics of the Recruited Subjects
Figure 1 The expression level of miR-218 in chronic obstructive pulmonary disease. (A and B) Forced expiratory volume in one second (FEV1) % index and the relative level of miR-218 were displayed in non-smokers, smokers and COPD tissues. (C) The correlation relationship between FEV1% index and miR-218 level was analyzed in COPD patients by Pearson’s correlation analysis. (D–F) Pearson’s correlation analysis was used to analyze the correlation relationship between miR-218 and serum IL-6, IL-8, and TNF-α levels. Data are shown as mean ± SD from three independent experiments. *P < 0.05, **P < 0.01, ***P < 0.001.
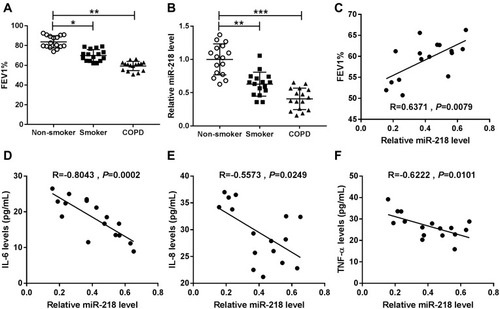
Figure 2 MiR-218 overexpression weakened apoptosis and inflammation in CSE-induced BEAS-2B cells. (A and B) The relative expression level of miR-218 was evaluated by RT-qPCR in BEAS-2B cells treated with different concentrations of CSE (0%, 1%, 2%, 4%, and 8%) for 24 h or treated with 2% CSE for different times (0 h, 12 h, 24 h, 36 h, and 48 h). (C) The expression of miR-218 was assessed by RT-qPCR assay in CSE-induced BEAS-2B cells transfected with miR-218 or miR-NC. (D–F) The levels of IL-6, IL-8, and TNF-α were measured by ELISA kit in the supernatants. (G) Apoptotic cells were monitored by flow cytometry assay. Data are shown as mean ± SD from three independent experiments. *P < 0.05, **P < 0.01, ***P < 0.001.
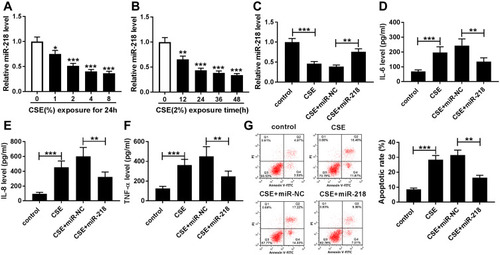
Figure 3 BRD4 was a target of miR-218. (A) The binding sites between miR-218 and 3ʹUTR of BRD4 are shown. (B) Luciferase activity was assessed by dual-luciferase report assay cells. (C) The RIP assay was conducted to test interaction between miR-218 and BRD4 BEAS-2B cells. Data are shown as mean ± SD from three independent experiments. ***P < 0.001.
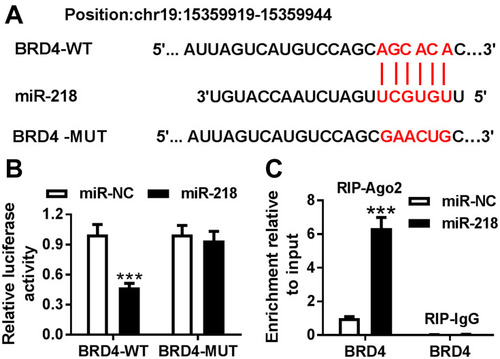
Figure 4 The expression level of BRD4 in COPD tissues and CSE-induced BEAS-2B cells. (A) RT-qPCR assay was performed to determine BRD4 level in COPD tissues and control groups. (B) Pearson’s correlation analysis was performed to analyze correlation relationship between miR-218 and BRD4 in COPD tissues. (C–F) RT-qPCR and Western blot assay were used to assess BRD4 levels in CSE-induced BEAS-2B cells. (G) The protein level of BRD4 was analyzed by Western blot assay in CSE-induced BEAS-2B cells transfected with miR-NC, miR-218, anti-miR-NC, anti-miR-218. Data are shown as mean ± SD from three independent experiments. *P < 0.05, **P < 0.01, ***P < 0.001.
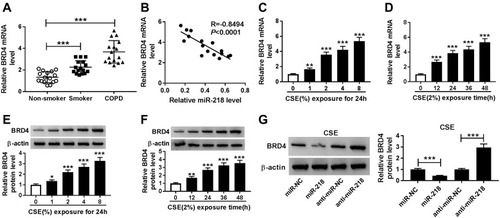
Figure 5 Knockdown of BRD4 inhibited CSE-induced apoptosis and inflammation in BEAS-2B cells. (A–E) BEAS-2B cells were divided into four groups: control, CSE, CSE+si-NC, and CSE+si-BRD4. (A) The protein level of BRD4 was measured by Western blot assay. (B–D) Inflammatory related factors (IL-6, IL-8, TNF-α) were measured by matched ELISA kits. (E) Flow cytometry assay was used to evaluate apoptosis of BEAS-2B cells. Data are shown as mean ± SD from three independent experiments. **P < 0.01, ***P < 0.001.
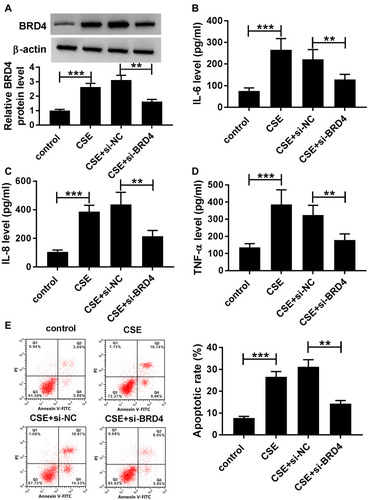
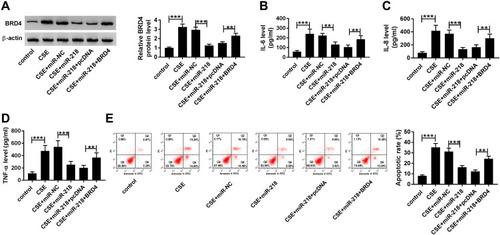
Figure 6 Overexpression of BRD4 attenuated effects of miR-218 upregulation on CSE-induced BEAS-2B cells. (A–E) BEAS-2B cells were divided into six groups: control, CSE, CSE+miR-NC, CSE+miR-218, CSE+miR-218+pcDNA, and CSE+miR-218+BRD4. (A) Western blot assay was carried out to assess level of BRD4. (B–D) The levels of IL-6, IL-8, TNF-α in cell supernatants were measured by ELISA kits. (E) The apoptosis of BEAS-2B cells was determined by flow cytometry assay. Data are shown as mean ± SD from three independent experiments. **P < 0.01, ***P < 0.001.