
Figures & data
Figure 1 Study design.
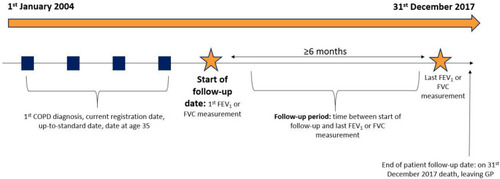
Table 1 Baseline Characteristics of Study Participants in Both FEV1 and FVC Cohorts
Figure 2 COPD patients included in the FEV1 and FVC cohorts.
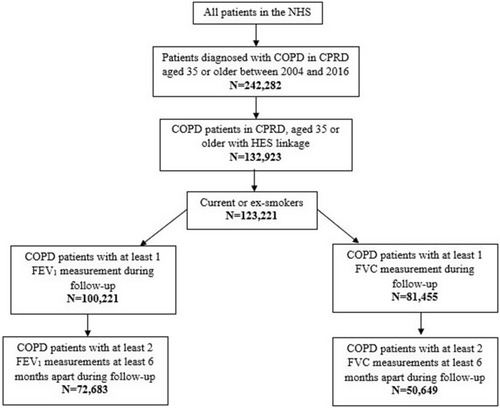
Figure 3 Distribution of the change in FEV1 and FVC1. 1Panel (A) shows the distribution in the change in FEV1 in 72,683 patients. Panel (B) shows the distribution in the change in FVC in 50,649 patients.
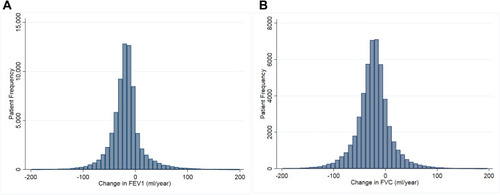
Table 2 Baseline Characteristics Associated with Accelerated Decline. Numbers are Adjusted OR (95% CI)