Figures & data
Table 1 Patient Demographic Data
Figure 1 Study flow chart.
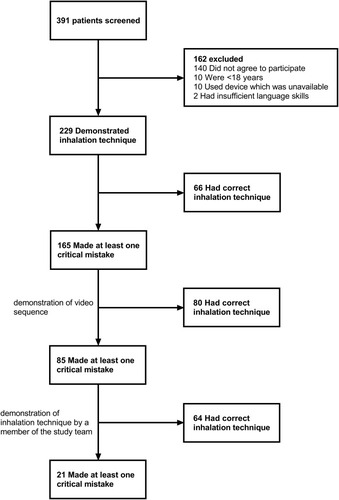
Table 2 Characteristics of Patients with Correct versus Incorrect Inhalation Technique
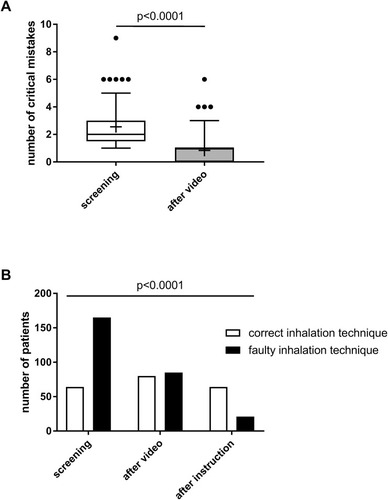
Figure 2 Inhalation technique. (A) The number of critical errors at screening and after having watched the video training material is given (n=165). Boxes represent interquartile range, whiskers demonstrate 5–95% percentile, means are indicated by the + symbol. (B) Number of patients with correct and faulty inhalation technique at screening (n=229), after having watched video training material (n=165), and after instruction by a member of the study team (n=85).