Figures & data
Table 1 Baseline Characteristics of the Study Population (N = 430), Overall and Stratified by Textiles of the Summit Lab Score
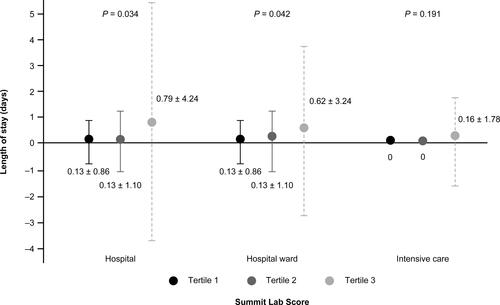
Figure 1 Kaplan–Meier survival curves for moderate-to-severe AECOPD by Summit Lab Score tertile.
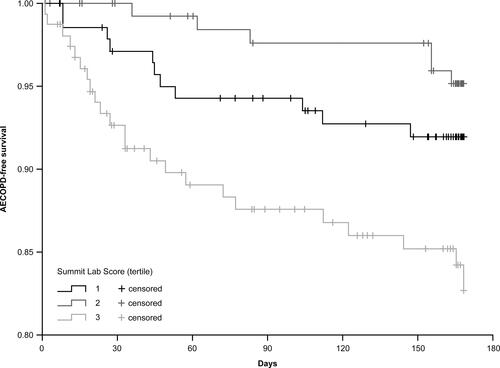
Figure 2 Kaplan–Meier survival curves for CV event by Summit Lab Score tertile. CV event includes any of the following: myocardial infarction, unstable angina, stroke, transient ischemic attack, or CV mortality.
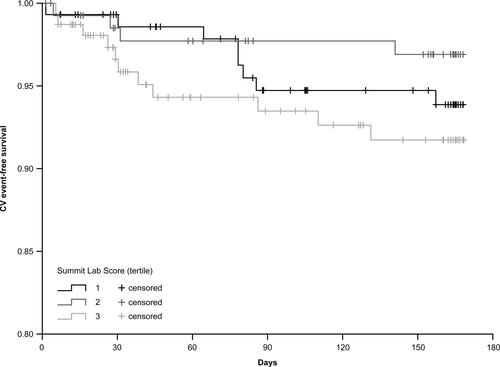
Table 2 Analysis of Spirometry Measures by Summit Lab Score Tertile
Figure 3 Length of stay (y-axis) in the hospital, hospital ward, or intensive care by Summit Lab Score tertile. P values are from tests of linear contrasts with coefficients of –1, 0 and 1. Error bars are the mean ± standard deviation, with the relevant mean and standard deviation provided on the graph near each tertile’s line.