Figures & data
Table 1 Characteristics of Patients Admitted with a COPD Hospitalization by Residence Location
Table 2 Unadjusted in-Hospital Mortality for Rural and Urban Residing Veterans Stratified by Hospital Rurality, Volume, Complexity, and Admission Source
Figure 1 Unadjusted in-hospital mortality by travel time to the nearest Veterans Health Administration primary care provider and hospital. In-hospital mortality between quartiles was compared by Cochran-Armitage Trend Test.
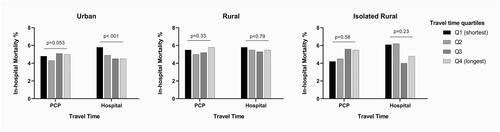
Figure 2 Multivariable logistic regression model for in-hospital mortality. Odds ratio with 95% confidence intervals are shown (x-axis) on log scale with base of 2. Low COPD-case volume hospitals were defined as hospitals with the annual rate of COPD admissions below the median.
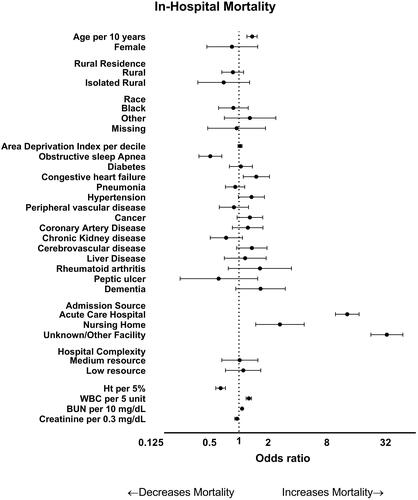
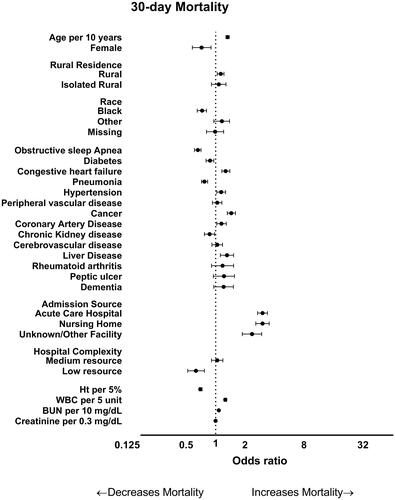
Figure 3 Multivariable logistic regression model for 30-day mortality. Odds ratio with 95% confidence intervals are shown (x-axis) on log scale with base of 2. Low COPD-case volume hospitals were defined as hospitals with the annual rate of COPD admissions below the median.