Figures & data
Table 1 Baseline Demographics
Figure 1 Parasternal intercostal muscle ultrasound.
Notes: (A) Ultrasound image of parasternal intercostal muscle; (B) Square method for measurement of parasternal intercostal echogenicity.
Abbreviations: R, ribs; PM, pectoralis major; Arrows, fascial border of parasternal intercostal muscle.
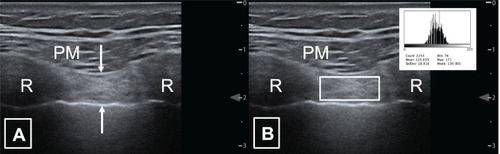
Table 2 Pre- and Post-Physiological and QoL Results
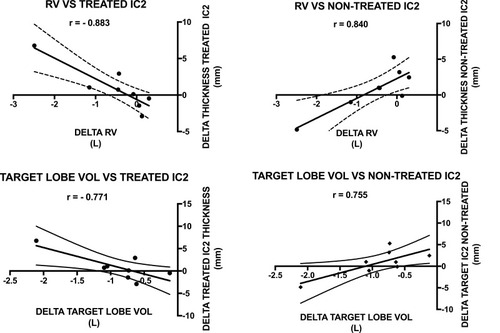
Figure 2 Relationship between change in residual volume, CT-target lobe volume and change in parasternal thickness following endobronchial valve insertion.
Notes: Regression line of change in parasternal muscle thickness compared to change in residual volume (dotted lines = 95% confidence interval).
Abbreviations: RV, residual volume (litres); Target lobe vol, CT-measured target lobe volume (litres); IC2, 2nd intercostal muscle (parasternal).