Figures & data
Figure 1 Study flow chart.
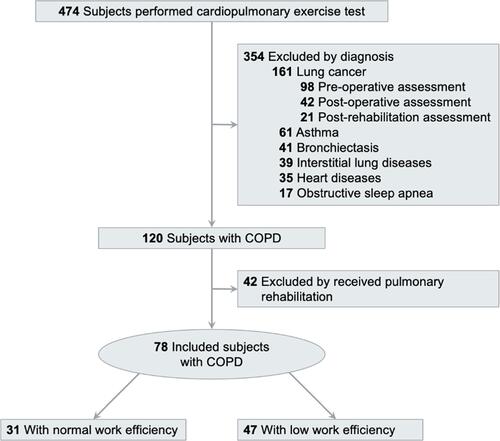
Table 1 Baseline Characteristics
Figure 2 Respiratory parameters. There was no significant difference in respiratory parameters such as FEV1/FVC% (A), FEV1% (B), FVC% (C), MIP (D), MEP (E), RR at rest (F), and VT at rest (H) or during exercise (I) between group I and group II (p > 0.05). However, the RR during exercise (G) was higher in group II than in group I (p < 0.05). *p < 0.05 as comparison between groups I and II.
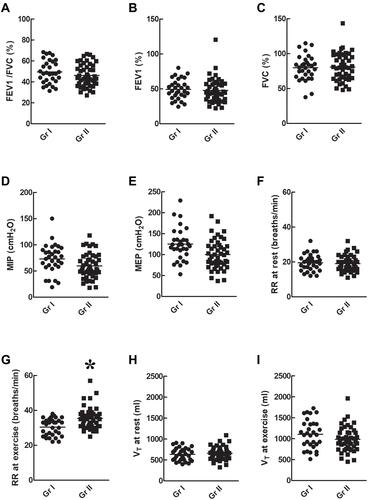
Figure 3 Circulatory parameters. WE (A), VO2 at maximal exercise (B) or AT (C), and O2P (D) were higher in group I than in group II (p < 0.05). There was no significant difference in HR at rest (E) or during exercise (F) and in MBP at rest (G) or during exercise (H) between the two groups (p > 0.05). *p<0.05 as comparison between group I and II.
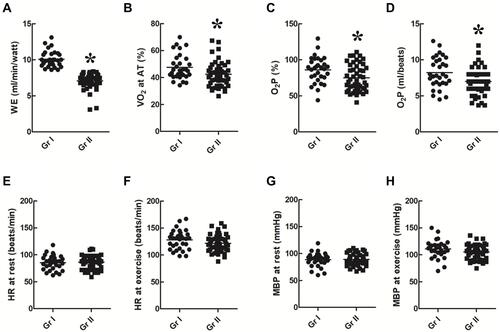
Figure 4 Gas exchanges. There was no difference in SpO2 at rest (A) or exercise (B) and PETCO2 at rest (C) or exercise (D) were between the two groups (p > 0.05).
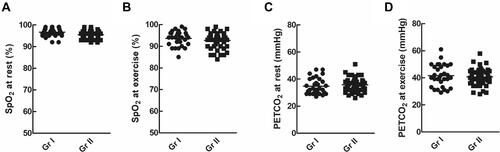
Figure 5 Exercise capacity. Maximal VO2% (A) and maximal VO2 (B) were higher in group I than in group II (p < 0.05). However, there was no significant difference in the maximal workload% (C) and maximal workload (D) between the two groups (p > 0.05). *p<0.05 as comparison between group I and II.
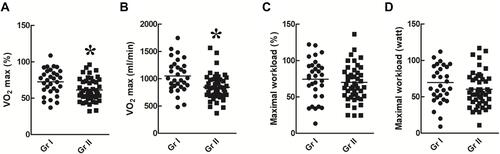
Figure 6 Dyspnea score and health-related quality of life. Dyspnea scores at rest (A) were similar between the two groups (p > 0.05), but dyspnea scores at maximal exercise (B) were significantly higher in group II than that in group I (p < 0.05). The SGRQ-total (C), -activity (D), -impact (E), and -symptom (F) scores were significantly poorer in group II than that in group I (p<0.05). *p<0.05 as comparison between group I and II.
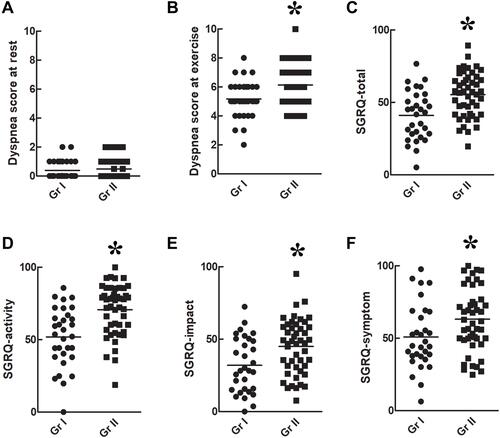
Table 2 Difference and Correlation Between WE and Variables
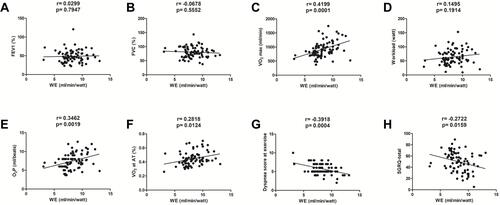
Figure 7 Correlation between WE and lung function, VO2 at maximal exercise and AT, O2P, dyspnea score, and HRQL. There was no significant correlation between WE and FEV1% (A) or FVC% (B) (both p > 0.05) between the two groups. A significant correlation was found between WE and VO2 (r = 0.4199, p = 0.001) (C), but not between WE and workload at maximal exercise (p > 0.05) (D). There were significant correlations between WE and O2P (r= 0.3462, p= 0.0019) (E), VO2 at the AT (r = 0.2818, p = 0.0124) (F), dyspnea score during exercise (r= 0.3918, p= 0.0004) (G), and SGRQ-total score (r = 0.2722, p = 0.0159) (H).