
Figures & data
Figure 1 Flow of patients with acute exacerbation of chronic obstructive pulmonary disease through the trial.
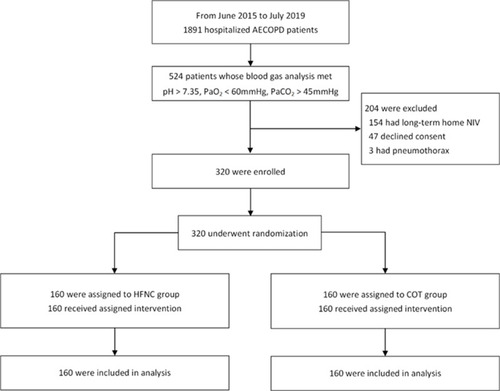
Table 1 Characteristics of Patients at Randomization
Table 2 Primary Endpoint and Secondary Endpoints in the Two Groups
Figure 2 Kaplan–Meier estimates of the probability of treatment success at 28 d between the high-flow nasal cannula oxygen therapy (HFNC) group and the conventional oxygen therapy (COT) group. Significant differences were found for the cumulative probability of treatment success for the two groups (Log rank test: p = 0.019).
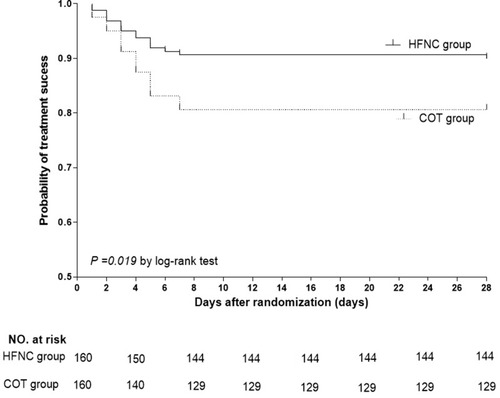
Table 3 Comparison of Physiological Parameters Between HFNC and COT Groups
Figure 3 Comparison of physiological parameters between the high-flow nasal cannula oxygen therapy (HFNC) group and the conventional oxygen therapy (COT) group. Shown are the time courses of partial pressure of arterial oxygen (PaO2), partial pressure of arterial carbon dioxide (PaCO2), arterial oxygen saturation (SaO2), and respiratory rate. pa represents the overall comparison of differences in each group over time, and pb represents overall comparisons of differences between groups over time.
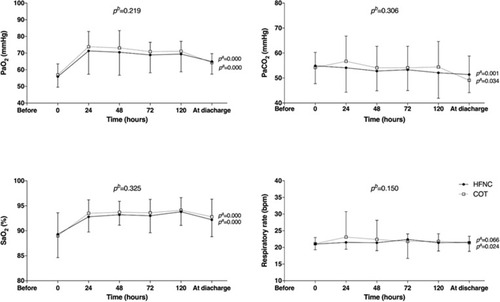
Table 4 Comparison of Physiological Parameters Between HFNC Success and Failure Groups
Table 5 Risk Factors Associated with HFNC Failure in Multivariate Analysis
Figure 4 Comparison of physiological parameters between high-flow nasal cannula oxygen therapy success and failure groups. Shown are the time courses of partial pressure of arterial oxygen (PaO2), partial pressure of arterial carbon dioxide (PaCO2), arterial oxygen saturation (SaO2), and respiratory rate. pa represents overall comparisons of differences in each group over time, and pb represents overall comparisons of differences between groups over time.
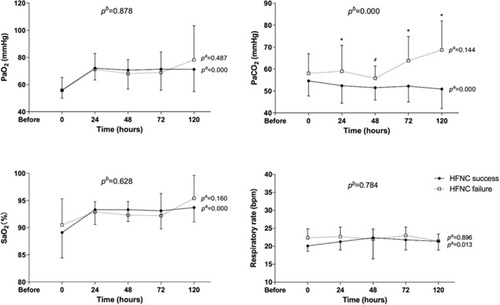
Table 6 Side Effects of HFNC Treatment