Figures & data
Table 1 Clinical Characteristics of Study Subjects at Inclusiona
Table 2 Exacerbation Frequency and Comorbidities
Figure 1 Serum levels of Galectin-3 during stable clinical conditions. (A) The level of Galectin-3 in serum from healthy never smoker (HNS; n=10, light grey dots) as well as from long-term smokers without (LTS; n=10, dark grey dots) and with chronic obstructive pulmonary disease and chronic bronchitis during stable clinical conditions at the time inclusion (COPD-CB inclusion; n=56, white dots). (B) The level of Galectin-3 and (C) the level of CRP in serum from COPD-CB patients at the time of inclusion that either remained in a stable clinical phase (remained stable; n=22 for both Galectin-3 and CRP) or developed an exacerbation (developed EXA; n=34 for Galectin-3, n=33 for CRP) during the course of the study. The data is presented as individual dots and median (bold line). Statistical analysis was performed using (A) a Kruskal–Wallis test followed by Dunn’s multiple comparison test or (B–C) a Mann–Whitney U test.
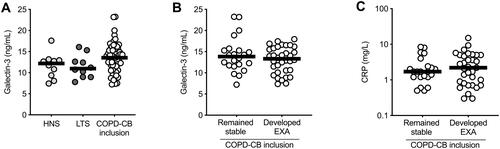
Figure 2 Serum levels of Galectin-3 during exacerbations. The levels of (A) Galectin-3 (n=29) and (B) CRP (n=34) were measured in serum within each patient with chronic obstructive pulmonary disease and chronic bronchitis (COPD-CB) during stable clinical conditions at the most recent visit prior to an exacerbation (pre-EXA; white squares) and during the exacerbation (EXA; grey squares). Certain patients suffered from an exacerbation within the first 15 weeks of the 15 months’ course of the study, hence the inclusion sample constitute 11 of the 29 pre-EXA samples in (A) and 14 of the 34 pre-EXA samples in (B). The data is presented as individual dots and median (bold line). Statistical analysis was performed using Wilcoxon signed-rank test. Statistically significant differences are indicated as follows: *p-value <0.05; ***p-value <0.001.
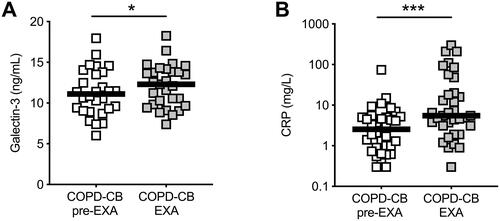
Figure 3 Serum levels of Galectin-3 in relation to bacterial growth in sputum samples. Sputum samples were obtained from patients with chronic obstructive pulmonary disease and chronic bronchitis (COPD-CB) during (A) stable clinical conditions at the time of inclusion (n=36, white dots) and (B) and during exacerbation (EXA; n=19, grey squares) and the data show the level of Galectin-3 in serum in relation to the type of bacterial growth of oropharyngeal flora (inclusion, n=18, EXA n=7), common respiratory pathogens (inclusion, n=14, EXA n=12), and opportunistic pathogens (inclusion, n=4). The data is presented as individual dots and median (bold line). Statistical analysis was performed using (A), a Kruskal–Wallis test followed by Dunn’s multiple comparison test or (B), a Mann–Whitney U test.
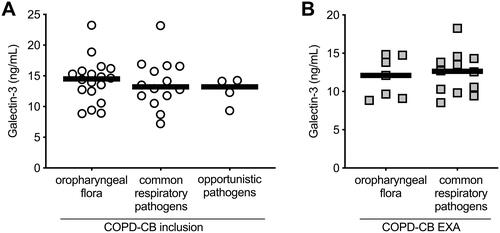
Figure 4 Alterations in total white blood cells and neutrophils during exacerbations. The absolute counts (x109/L) of (A) leukocytes, (B) neutrophils and (C) monocytes were analyzed in blood from the same patients with chronic obstructive pulmonary disease and chronic bronchitis (COPD-CB) during stable clinical conditions at the most recent visit prior to an exacerbation (pre-EXA; n=34, white squares) and during the exacerbation (EXA; n=34, grey squares). Certain patients suffered from an exacerbation within the first 15 weeks of the 15 months’ course of the study, hence the inclusion sample constitute 14 of the 34 pre-EXA samples in (A–C). The data is presented as individual dots and median (bold line). Statistical analysis was performed using Wilcoxon signed-rank test. Statistically significant differences are indicated as follows: **p-value <0.01; ***p-value <0.001.
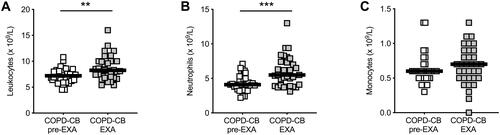
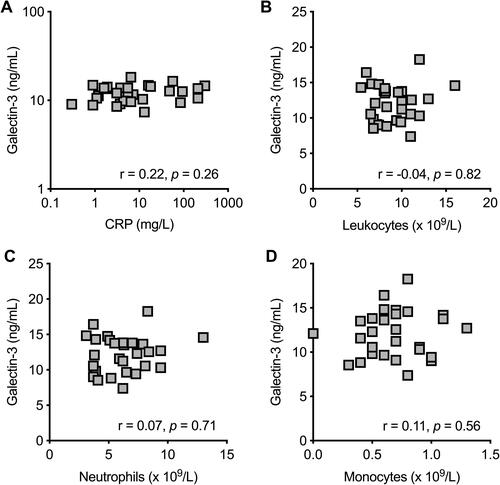
Figure 5 Galectin-3 versus CRP, white blood cells, neutrophils and monocytes during exacerbations. Correlations between the level of (A) CRP (measured in serum), and absolute counts of (B) leukocytes, (C) neutrophils and (D) monocytes (measured in blood) and the level of Galectin-3 (measured in serum) from patients with chronic obstructive pulmonary disease and chronic bronchitis (COPD-CB) during exacerbations (n=29). Statistical analysis was performed using Spearman’s rank correlation (the rho- and p-values are shown in each figure).