
Figures & data
Table 1 Comparison of University of Iowa Radiologists’ Readings with QCT
Figure 1 Overlap of discordant groups from comparisons of University of Iowa radiologists versus quantitative computed tomography (QCT) and COPDGene radiologists versus QCT. (A) Visual-only emphysema. (B) Quantitative-only emphysema.
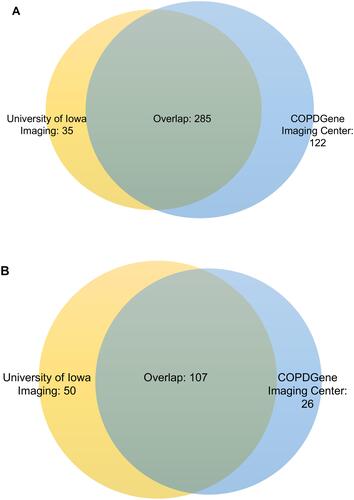
Figure 2 Continued.
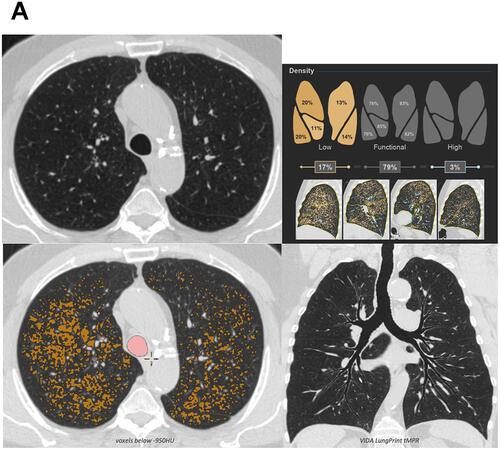
Figure 2 Examples of discordant assessments. (A) The computed tomography was visually interpreted as negative for emphysema but emphysema was identified quantitatively; axial multiplanar reformat (MPR) (upper left), low attenuation area (LAA) percentages by lung lobe (upper right), axial MPR with LAA overlay (lower left), and topographic MPR (lower right) provided. Quantitative measures correlated with spirometry in this participant. (B) Visual-only identified emphysema. Small areas identified quantitatively but were not above the LAA ≤950 Hounsfield units 5% threshold; axial MPR (upper left), LAA percentages by lung lobe (upper right), axial MPR with LAA overlay (lower left), and topographic MPR (lower right) provided. Quantitative measures also correlated with spirometry. Images courtesy of VIDA, Coralville, Iowa, USA.
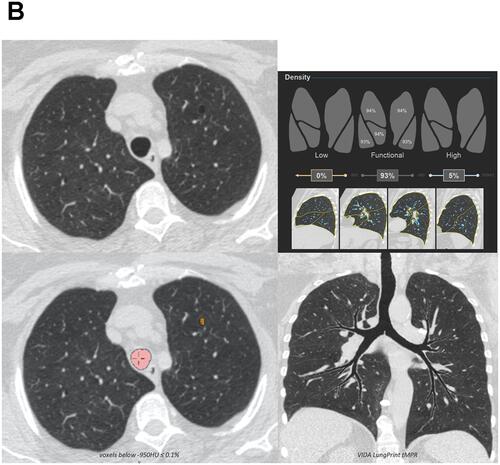
Table 2 Demographics and Baseline Assessments Grouped by the Agreement of Visual Assessments by University of Iowa Radiologists with QCT
Figure 3 Factors associated with discordance (multivariable stepwise logistic regression) Adjusted analysis comparing quantitative-only emphysema and visual-only emphysema (University of Iowa). Variables tested but not retained in the final model: functional residual capacity percent predicted and chronic bronchitis.
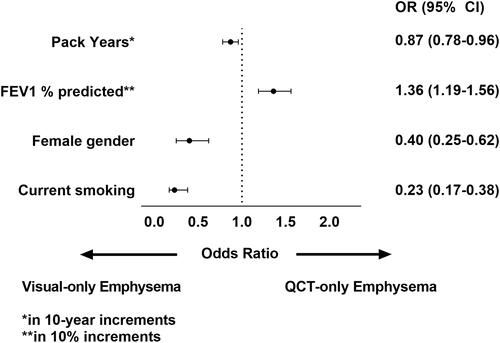
Figure 4 Sensitivity of visually-detected emphysema at various quantitative computed tomography diagnostic thresholds.
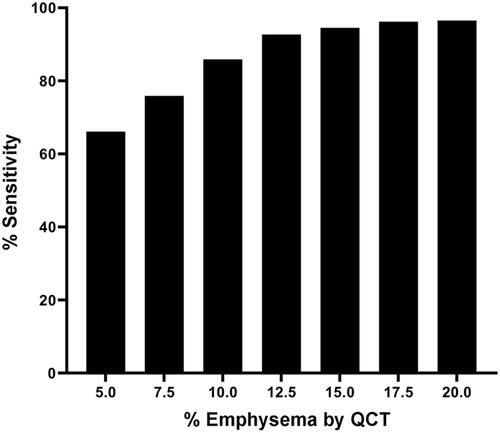
Table 3 Multivariable Regression Models with AIC