Figures & data
Table 1 Study Data Details: Duration, Treatment Arms, FEV1 Measurement Schedule
Table 2 Summary of Baseline Characteristics, by Study
Figure 1 Overview of the joint models of individual longitudinal FEV1 and exacerbation hazard, indicating the covariates, and longitudinal data, included in the base model and the model for prediction of FEV1 and exacerbation hazard. Prognostic factors refer to additional baseline covariates identified in the covariate search.
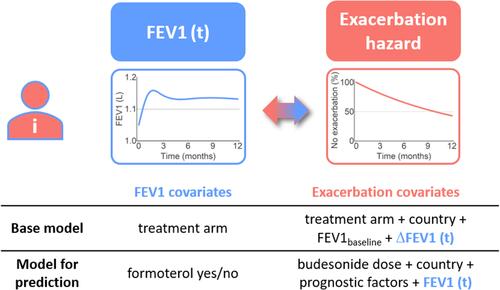
Table 3 Estimated Hazard Ratiosa for Exacerbation Risk (Cox Model and Base Joint Model, Study A)
Figure 2 Diagnostics of the joint model for prediction fitted to Study A. Mean of individual predictions of FEV1 (A) and change from baseline FEV1 (B) with 95% CI (solid colored lines and shaded areas), superimposed with individual profiles (thin colored lines) and means of the original data (stars) vs time. (C) Predicted mean exacerbation-free probabilities (solid line) with interquartile range (shaded area) and Kaplan–Meier estimates (dashed line).
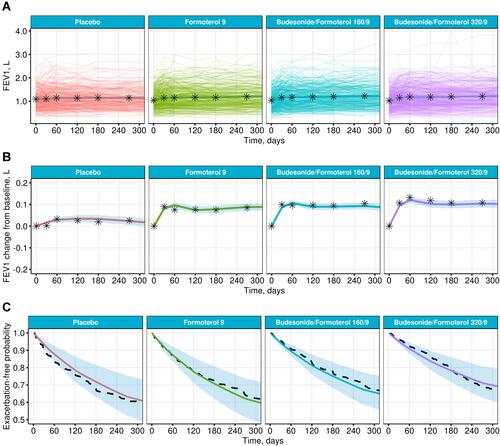
Figure 3 Prediction of exacerbation outcomes, for patients in the USA, in Study B (A) and Study C (B), using the joint model for prediction developed on Study A, and a 1-month data cut-off. Predicted exacerbation-free probabilities (means and 95% CI, blue) vs Kaplan–Meier estimates (dashed line). The shaded area in (A) denotes additional treatment arms in Study B which was not included in Study A.
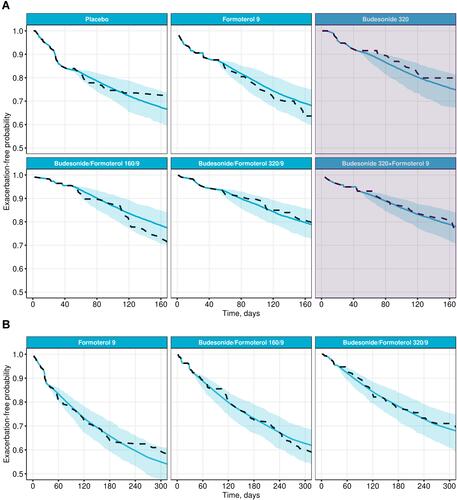
Figure 4 Parameter estimates of the joint model for prediction with 95% CI per study. Histograms show the instantaneous exacerbation risk change with respect to the relative parameter change.
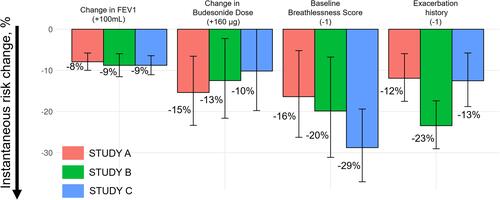
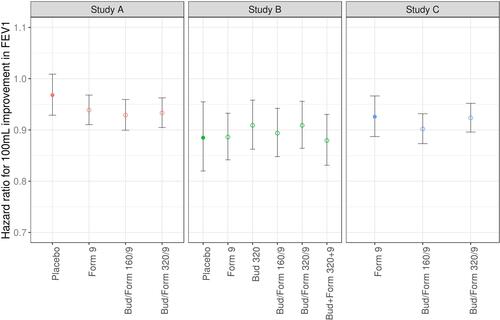
Figure 5 Estimated hazard ratio per 100 mL improvement in FEV1 per study arm for each study; for the reference arm alone (filled circles) and each treatment arm vs reference (open circles). Error bars represent 95% CI.