Figures & data
Figure 1 Flowchart of patients. FEV1, forced expiratory volume in 1 second; CAT, COPD assessment test. *Some patients could have been excluded by more than one exclusion criterion.
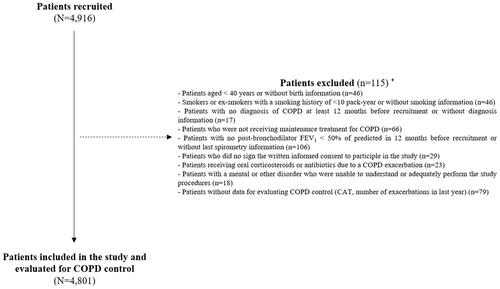
Table 1 Demographic and Clinical Characteristics of Patients, Considering Clinical Impact and Stability of COPD
Figure 2 Clinical control of COPD assessed by CCC. Percentage of recruited patients considering: (A) clinical impact or clinical stability; (B) clinical impact and stability.

Figure 3 Clinical control of COPD assessed by CAT score and exacerbations in the last 3 months. Percentage of recruited patients considering: (A) clinical variables; (B) COPD control.
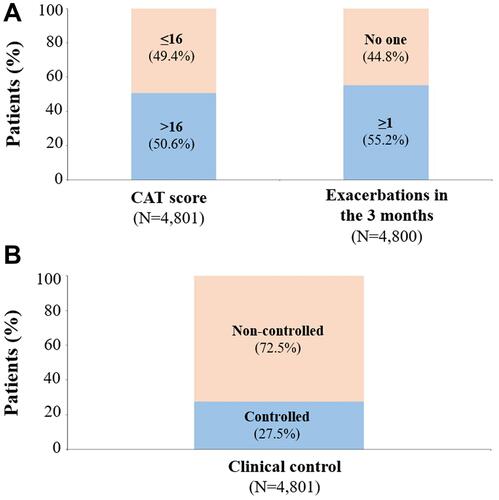
Table 2 Factors Independently Associated with Clinical Control of COPD
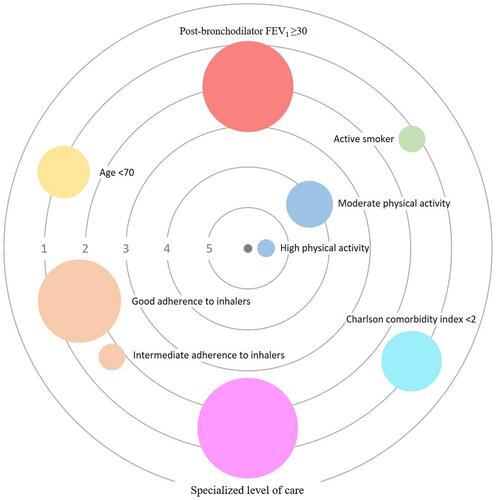
Figure 4 Strength of the association between independent factors and COPD control. Categorical factors are shown as circles, whereas continuous ones as squares. Each factor has a specific color. The size of each circle/square is proportional to the prevalence of the factor. The central black circle (center) represents COPD control. Concentric grey circles express the strength of the association, by using odds ratio (values 1 to 5). The proximity to the center is proportional to the odds ratio; thus, a factor with higher odds ratio (high association with COPD control) is closer to the center. Reference factors are: age (≥70 years); smoking habits (ex-smoker); physical activity (low); adherence to inhalers (poor); and primary level of care.