Figures & data
Figure 1 Study flow chart (screened patients n=222).
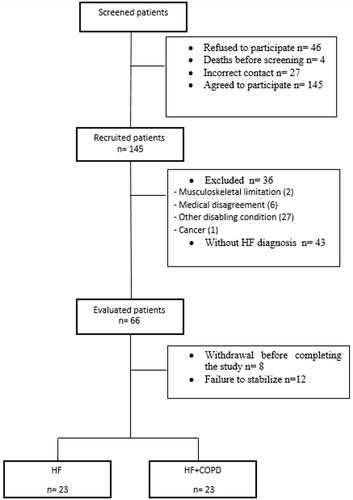
Table 1 Anthropometric and Clinical Characteristics of Studied Subjects
Table 2 Comparison Between Group Responses to Incremental CPET
Figure 2 Correlation between cardiac function and CPET responses in CHF group; Used Pearson correlation coefficient. LV, left ventricle; In (A) relationship between log-ventilatory power and log-relative wall thickness (r: 0.45 p: 0.03); (B) relationship between VE/VCO2 intercept and Mitral E/e’ ratio (r: 0.70 p: 0.003).
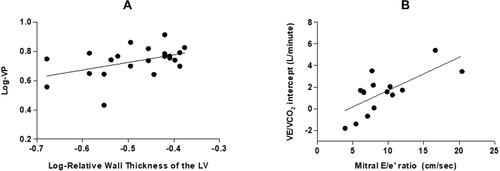
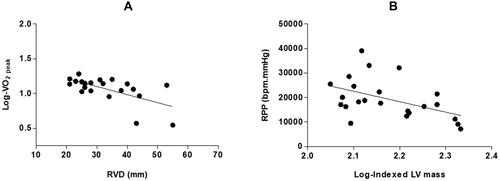
Figure 3 Correlation between cardiac function and CPET responses in CHF+COPD group; Used Pearson correlation coefficient. LV, left ventricle; In (A) log-relative VO2 and right ventricle diameter (r: −0.47; p: 0.02); (B) log-indexed LV mass and rate pressure product (r: −0.62; p: 0.001).