
Figures & data
Table 1 Patient Demographics and Characteristics by Reported History of Exacerbations
Table 2 Exacerbation Outcomes by Reported History of Exacerbations in the Previous 12 Months (Efficacy Estimand, mITT Population)
Figure 1 Treatment comparisons for rate of moderate/severe exacerbations by reported exacerbation history (mITT population; efficacy estimand).
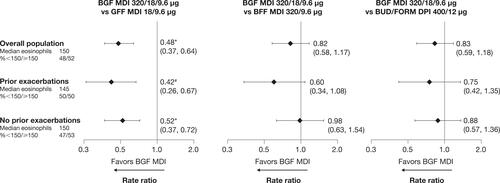
Figure 2 Rate of moderate/severe exacerbations for patients reporting (A) a prior exacerbation and (B) no prior exacerbations as a function of baseline eosinophil and treatment group (mITT population, efficacy estimand). Generalized additive model plot. Banded areas represent 95% CIs.
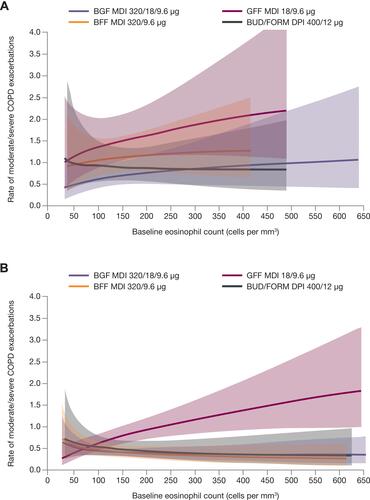
Table 3 Comparison of TEAEs for No Prior Exacerbations and Prior Exacerbations Subgroups (Safety Population)