
Figures & data
Figure 1 Euler diagram showing proportion of undiagnosed, misdiagnosed and confirmed COPD in the sample.
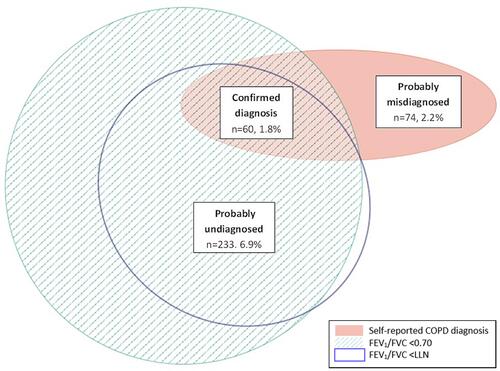
Table 1 Participant Characteristics
Table 2 Predictors of Probably Undiagnosed COPD (versus Normal Lung Function)
Table 3 Predictors of Probably Misdiagnosed COPD (versus Confirmed Diagnosis of COPD)