Figures & data
Table 1 The 40 Differentially Expressed Autophagy-Related Genes in COPD Samples Compared to Healthy Samples
Figure 1 Differentially expressed autophagy-related genes in COPD and healthy samples. (A) Principal component analysis for GSE38974. (B) Volcano plot of the 222 differentially expressed autophagy-related genes. The red dots represent the significantly up-regulated genes and the blue dots indicate the significantly down-regulated genes. (C) Heatmap of the 40 differentially expressed autophagy-related genes in COPD and healthy samples.
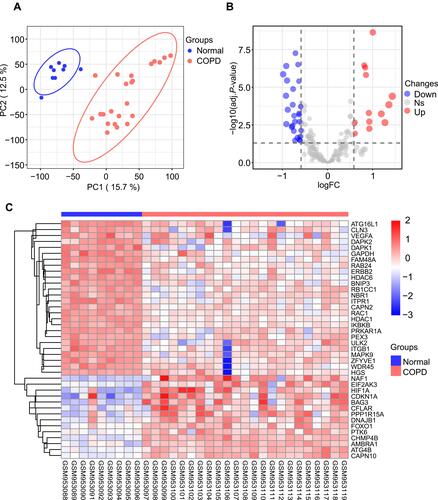
Figure 2 The boxplot of 40 differentially expressed autophagy-related genes in COPD and healthy samples. (A) The boxplot of top 20 differentially expressed autophagy-related genes in COPD and healthy samples. (B) The boxplot of last 20 differentially expressed autophagy-related genes in COPD and healthy samples.
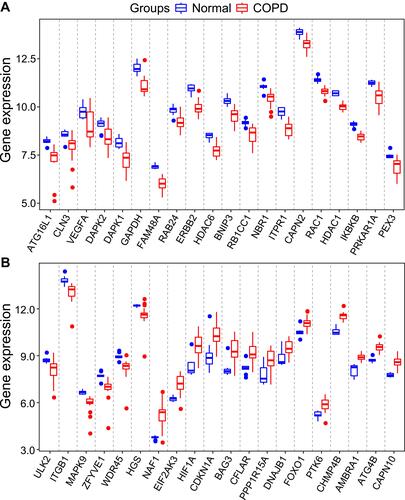
Figure 3 Protein–protein interactions (PPI) analysis the 40 differentially expressed autophagy-related genes. (A) The PPI among 40 differentially expressed autophagy-related genes. (B) The interaction number of each differentially expressed autophagy-related gene.
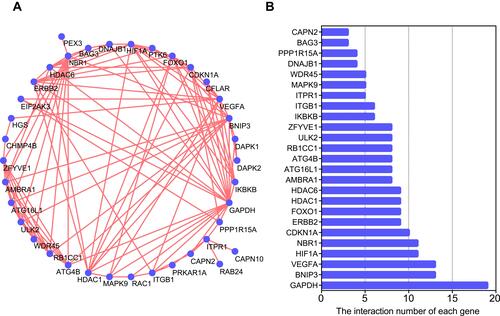
Figure 4 Spearman correlation analysis of the 40 differentially expressed autophagy-related genes.
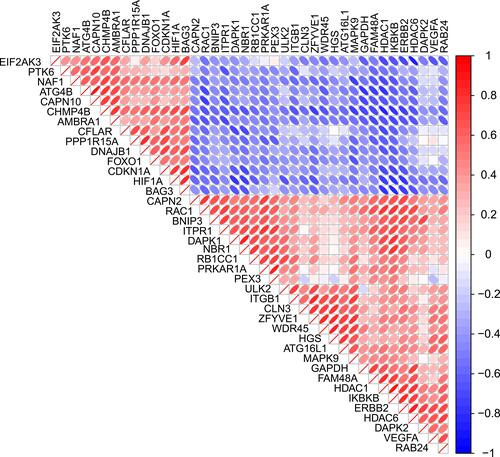
Figure 5 Gene Ontology (GO) enrichment analysis of 40 differentially expressed autophagy-related genes. (A) and (B) Bubble plot of enriched GO terms.
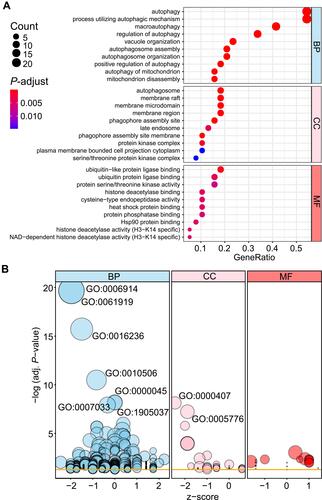
Figure 6 Kyoto Encyclopedia of Genes and Genomes (KEGG) analysis of 40 differentially expressed autophagy-related genes.
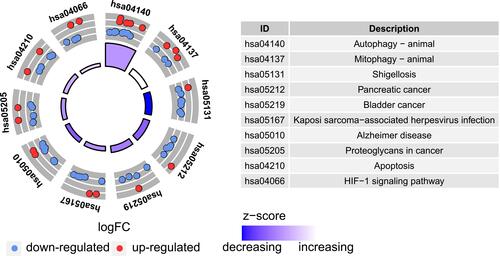
Table 2 Clinicopathological Variables of Cases and Controls in This Study
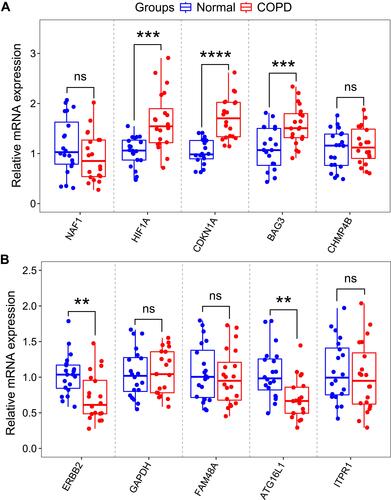
Figure 7 RNA expression of top five autophagy-related genes were measured in COPD and healthy samples. (A) RNA expression of NAF1, HIF1A, CDKN1A, BAG3 and CHMP4B were measured in blood samples using qRT-PCR. (B) RNA expression of ERBB2, GAPDH, FAM48A, ATG16L1 and ITPR1 were measured in blood samples using qRT-PCR. P-values were calculated using a two-sided unpaired Student’s t-test. **P<0.01; ***P<0.001; ****P<0.0001.