Figures & data
Table 1 Demographic and Clinical Characteristics of Patients at Baseline
Table 2 Hospital Admissions, Symptoms Scores and pCO2 Before and After 1 Year NIV
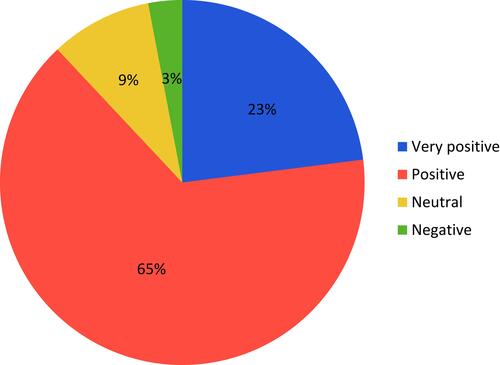
Figure 1 Mean MRC dyspnea score, CCQ score and HADS score at baseline and after 1 year NIV treatment.
Abbreviations: NIV, non-invasive ventilation; MRC, Medical Research Council; CCQ, Clinical COPD Questionnaire; HADS, Hospital Anxiety Depression Scale.
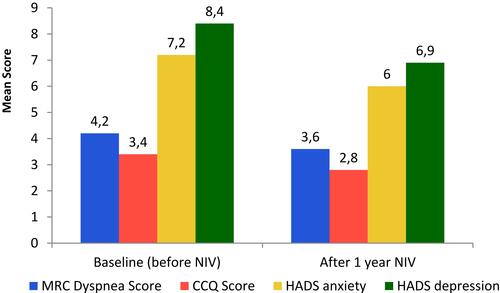
Table 3 NIV Usage, Type, and Setting
Figure 2 Sleep quality after one year of NIV (n=32). 31% of the patients showed some improvement in sleep quality, 53% did show a very clear improvement.
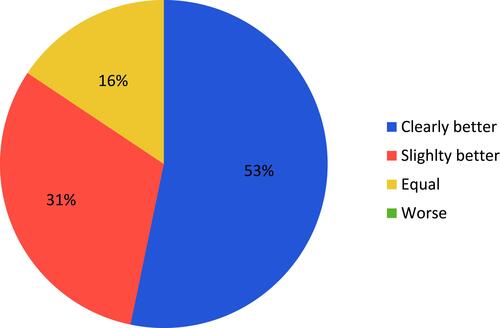
Figure 3 NIV experience after one year (n=32). 65% experienced NIV as positive, 23% as very positive.