
Figures & data
Figure 1 Disposition of patients.
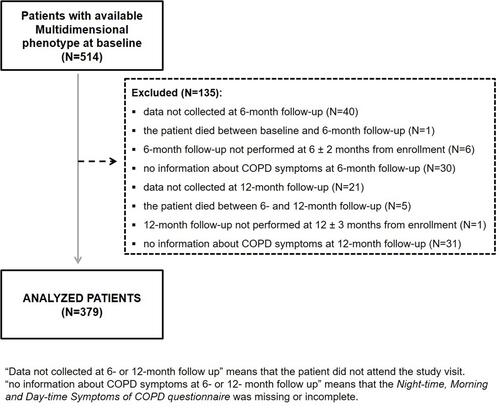
Table 1 Baseline Characteristics of Analyzed Patients
Table 2 Therapies for COPD Ongoing at Study Visits (by Multidimensional Phenotype)
Figure 2 (A) Frequency of patients with COPD symptoms by multidimensional phenotype at baseline. (B) Frequency of patients with COPD symptoms by multidimensional phenotype at 6-month follow-up. (C) Frequency of patients with COPD symptoms by multidimensional phenotype at 12-month follow-up.
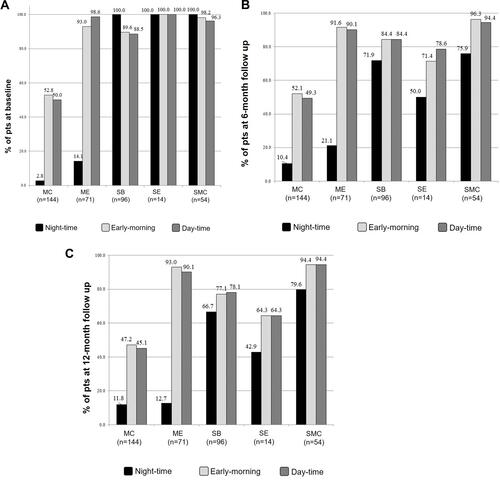
Table 3 1-Year Evolution of COPD Symptoms (by Multidimensional Phenotype)