Figures & data
Table 1 Patient Characteristics at Baseline
Figure 1 CONSORT flow diagram of the study enrollment process.Citation25
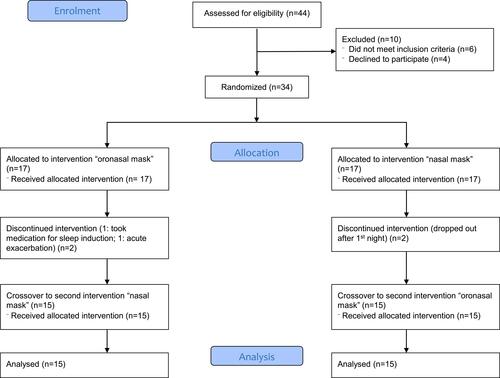
Table 2 Results of the Blood Gas Analyses, Transcutaneous PCO2 Monitoring, Pulse Oximetry and Polysomnography for Each Group
Figure 2 (A) Relative proportions of sleep efficiency (mean ± SD) with oronasal versus nasal masks (primary endpoint). (B) Relative proportions of stage-3/4 sleep (mean ± SD) with oronasal versus nasal masks (secondary endpoint).
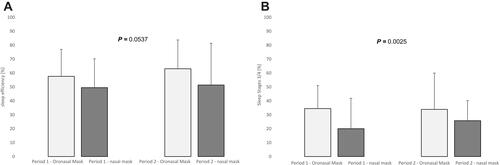
Figure 3 (A) Relative proportions of sleep efficiency (mean ± SD) with oronasal versus nasal masks in patients who were already accustomed to a nasal mask at study inclusion. Patients who had finally changed the interface are given in orange. (B) Relative proportions of sleep efficiency (mean ± SD) with oronasal versus nasal masks in patients who were already accustomed to an oronasal mask at study inclusion. Patients who had finally changed the interface are given in green.
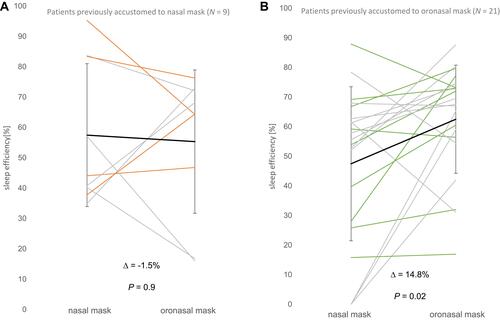
Figure 4 A visual analogue scale depicting the results of the subjective sleep survey on mask preference for nasal versus oronasal masks (Higher scores = does apply; lower scores = does not apply).
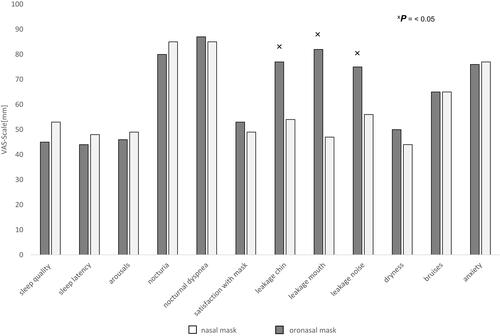
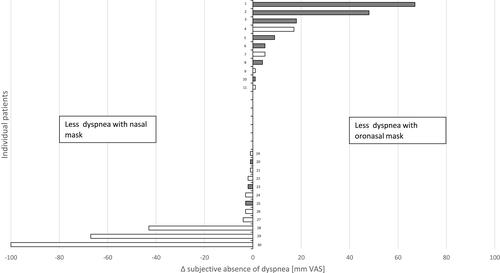
Figure 5 Individual subjective absence of dyspnea under each mask interface. Grey columns: patient favored oronasal mask. White columns: patient favored nasal mask.